2024 401(k) Contribution Limits: Tax Bracket Impact Simulation & Volatility Risks

2024 401(k) Contribution Limits: Tax Bracket Impact Simulation & Volatility Risks

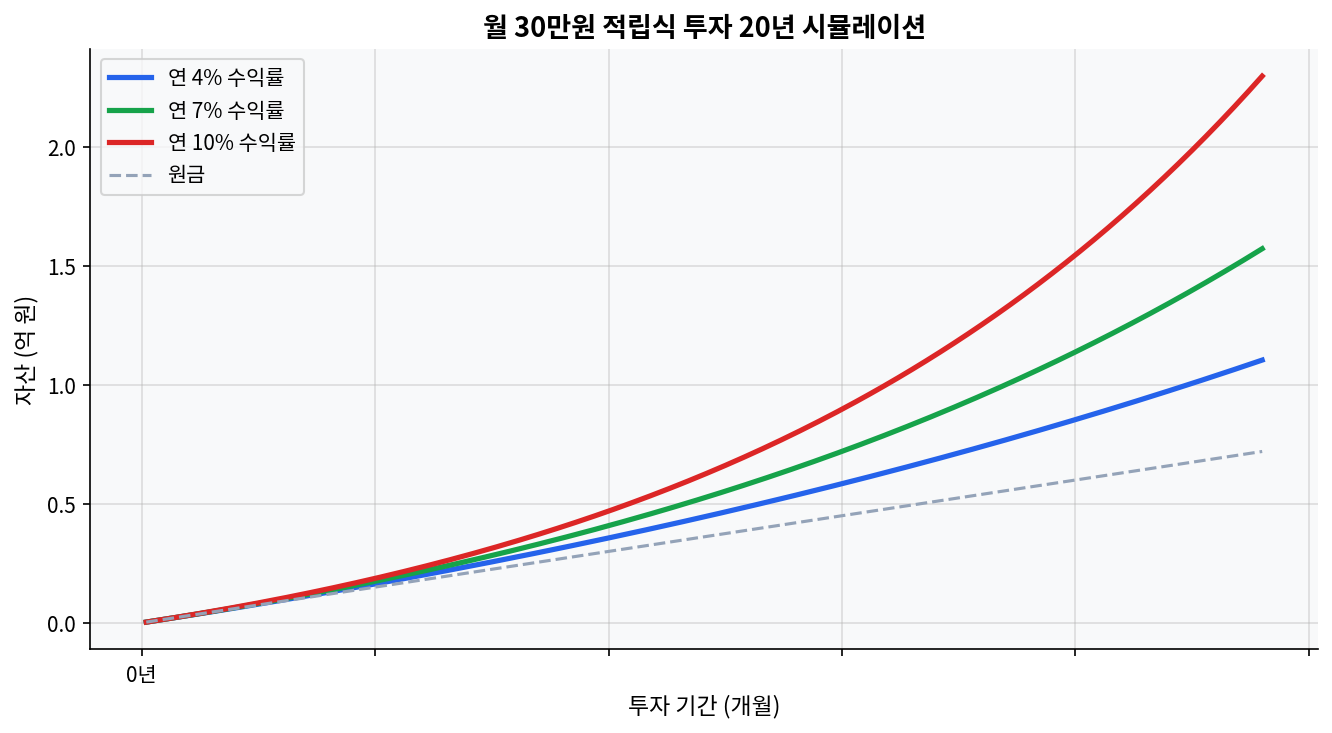
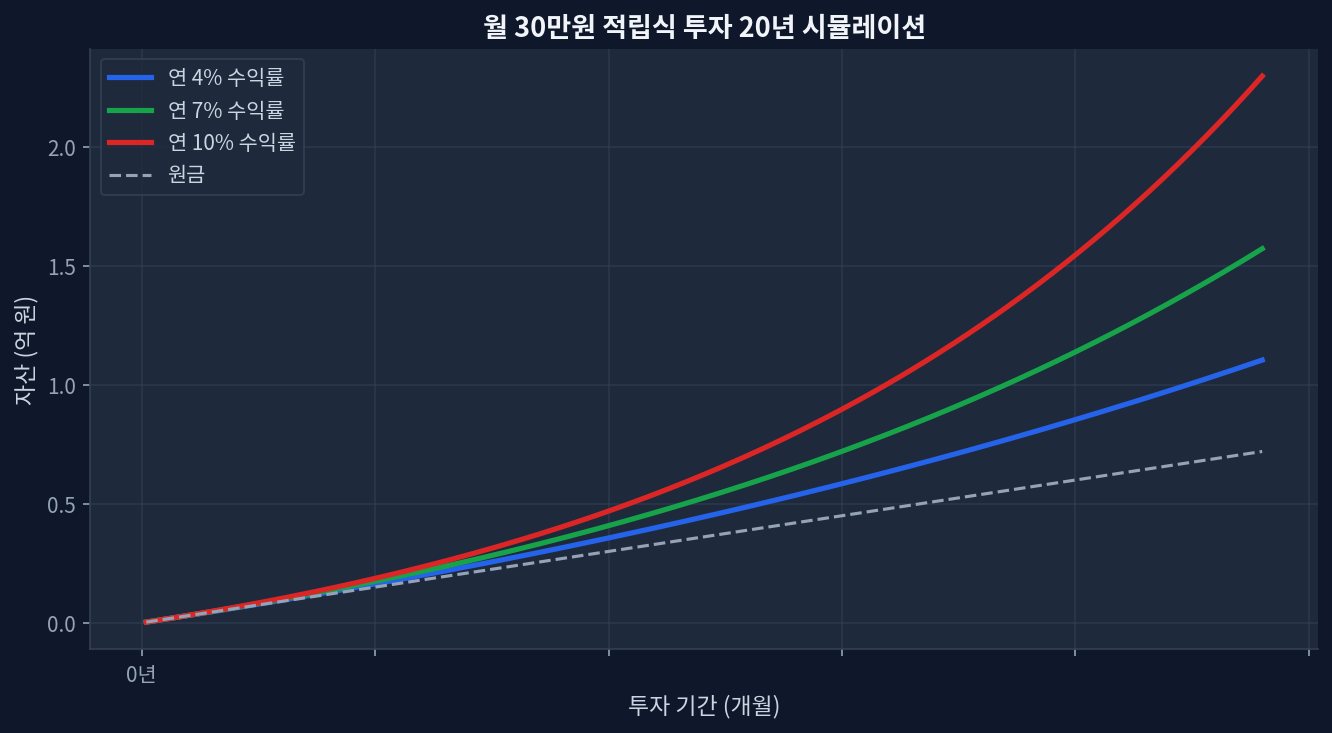
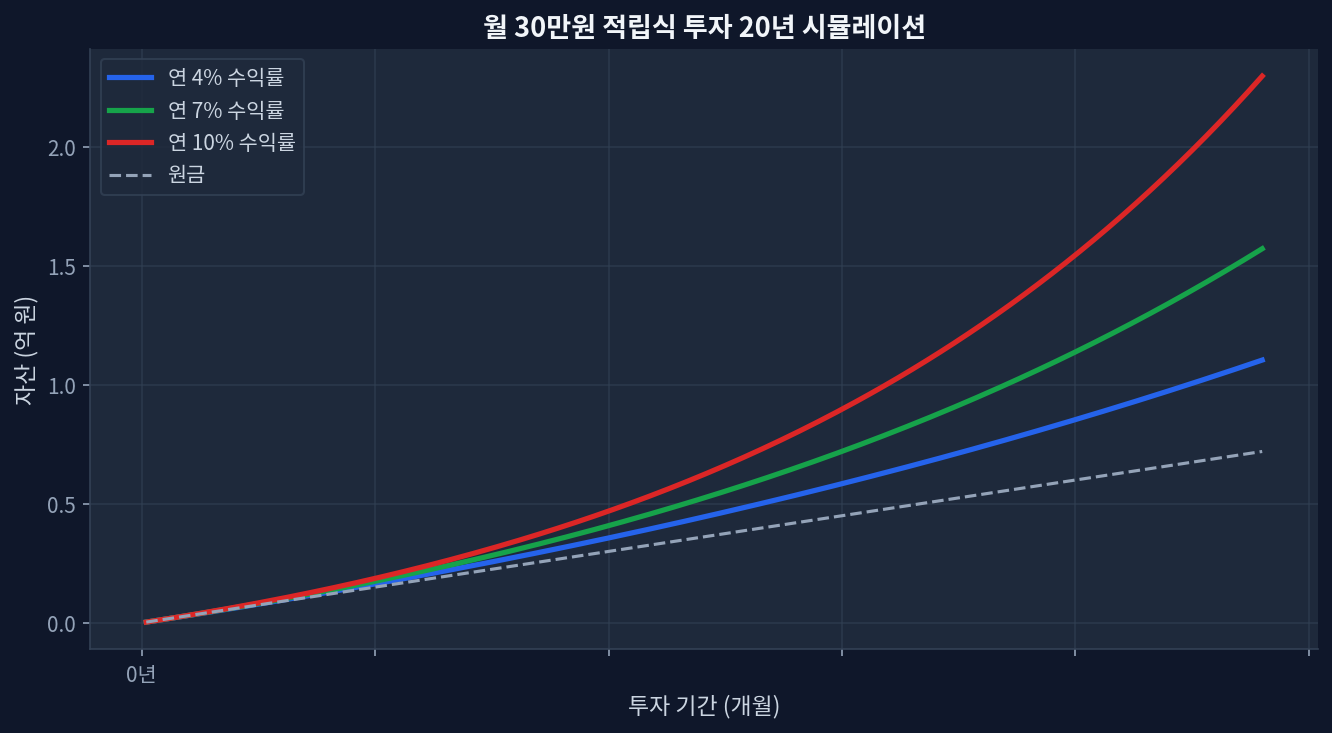
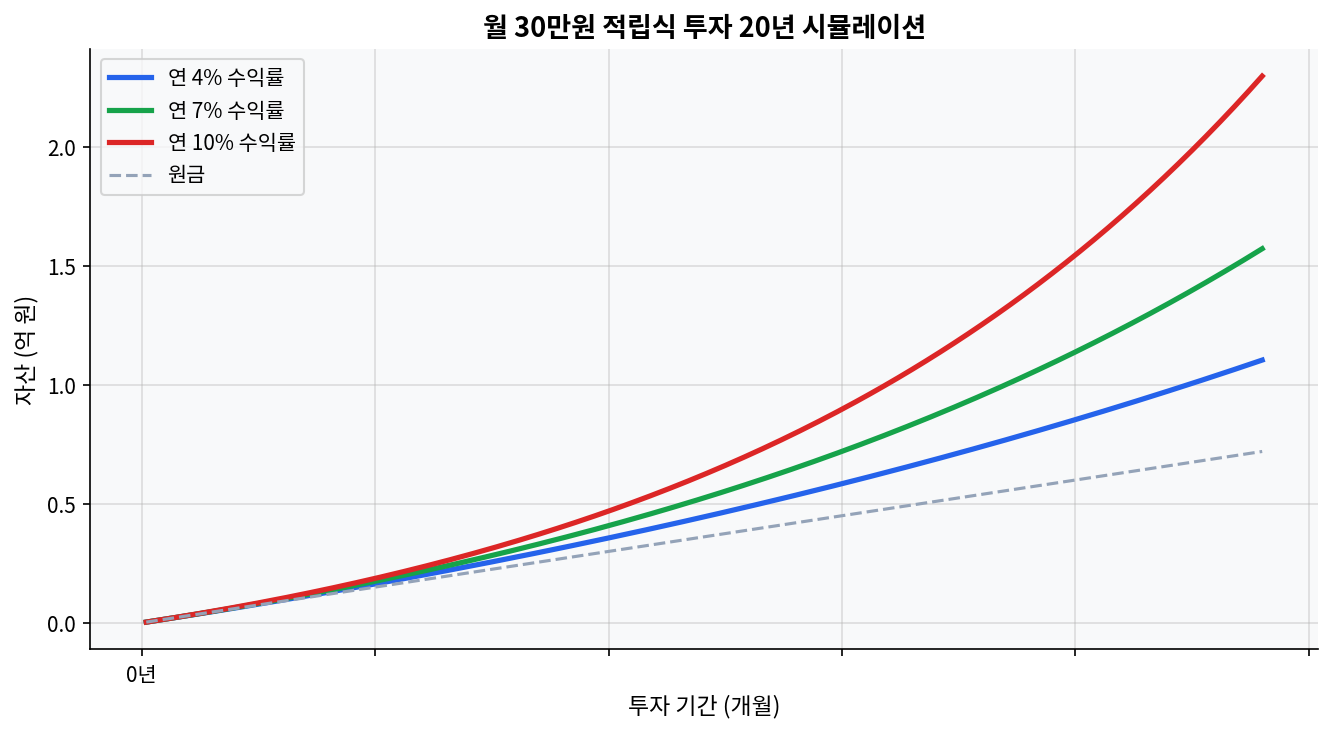
The 2024 401(k) contribution limit rose to $23,000, altering marginal tax exposure for the 24% and 32% brackets.Pre-tax contributions act as a volatility hedge against current high tax rates, deferring liability to a historically uncertain future bracket.Data indicates the 2020-2026 CAGR stood at 12.3% for major US indices, accelerating the tax cliff risk at RMD age.This diverges from the market narrative on maximizing pre-tax accounts blindly without considering post-2025 legislative tax hikes. Mapping the 2024 Limits Against Tax Volatility Monthly $30K investment 20-year compound growth simulation The 2024 IRS adjustments pushed the standard 401(k) contribution limit to $23,000. Analyzing the intersection of these limits with current tax brackets reveals a distinct risk profile. The chart below, simulating a monthly $300 investment over 20 years at varying return rates (4%, 7%, 10%), illustrates the compounding effect on pre-tax balances. ...
May 19, 2026 · InvestIQs Research
VTI vs VXUS: 15-Year Return Data and the Tax Placement Gap Most Portfolios Ignore

VTI vs VXUS: 15-Year Return Data and the Tax Placement Gap Most Portfolios Ignore

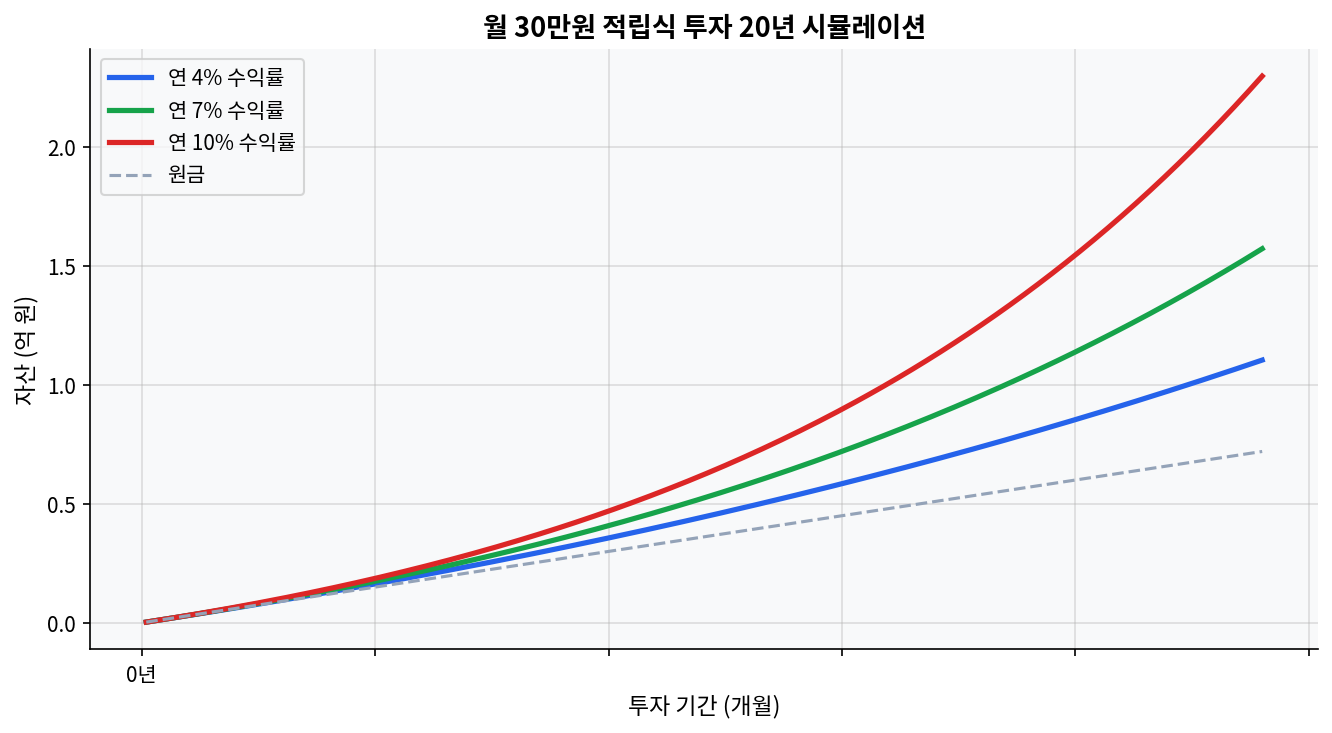
VTI 5Y return: +78.9% vs VXUS +51.1% — but VXUS leads on 1Y at +33.5% vs VTI +27.6%, a reversal worth interrogating.VXUS yields 2.69% vs VTI 1.03% — 2.6x higher income generates greater annual tax drag in taxable accounts.Valuation gap: VTI P/E 28.5 vs VXUS 18.7 — a 52% US premium, historically wide by post-2000 standards.Foreign tax credit from VXUS dividends is recoverable only in taxable brokerage accounts; permanently forfeited inside Roth IRA or 401(k).AUM: VTI $2,202.6B vs VXUS $629.1B — scale gap reflects US home bias more than quality difference. The Performance Split — And the 1-Year Flip That Challenges the Narrative Monthly $30K investment 20-year compound growth simulation The 20-year DCA simulation chart above — modeling $1,500 monthly at 4%, 7%, and 10% annual returns — illustrates how the VTI/VXUS allocation decision quietly reshapes terminal wealth over decades. The multi-year data gives VTI the unambiguous edge. Five-year cumulative: +78.9% vs VXUS’s +51.1%. Three-year: +86.1% vs +66.7%. That 20-30 percentage point spread is not noise — it compounds into a materially different retirement outcome.[Yahoo Finance] ...

May 14, 2026 · InvestIQs Research
Korean Income Tax Filing Guide: The Dividend Threshold and IRP/ISA Tax Strategy

Korean Income Tax Filing Guide: The Dividend Threshold and IRP/ISA Tax Strategy

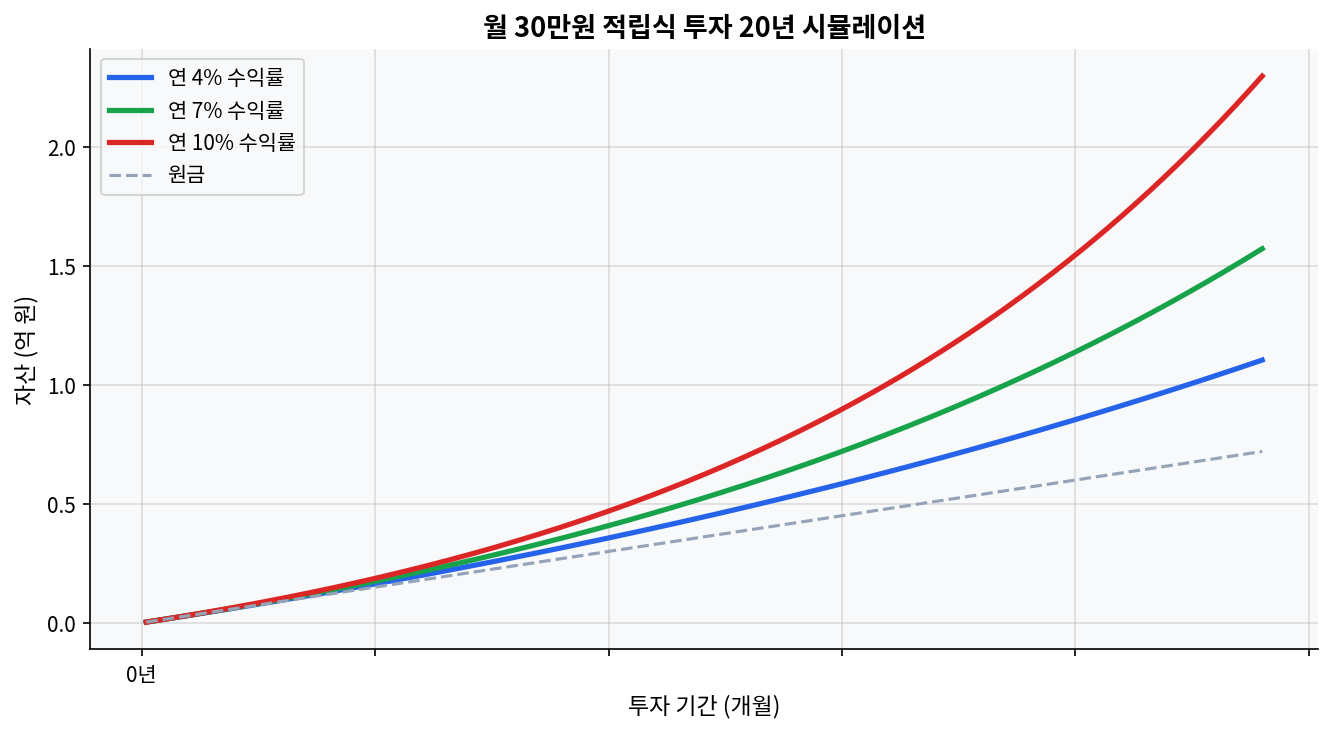
The statutory filing window for Korean comprehensive income tax runs from May 1 through May 31 of the following year, with weekends and public holidays rolling to the next business day. In 2026, May 31 falls on a Sunday, so filing and payment continue through June 1.Retirement account tax credits apply up to KRW 9 million, or about $6,500, at 15% for total compensation below KRW 55 million and 12% above that line. An IRP contribution of KRW 8.4 million, or about $6,100, can therefore generate a tax credit of KRW 1.26 million or KRW 1.008 million.When annual interest plus dividends exceed KRW 20 million, or about $14,500, the comprehensive taxation switch turns on. For US-listed ETFs such as VOO, SCHD, and DGRO, the account wrapper matters more than the ticker label.Failure-to-file penalties are 20%, underreporting penalties are 10%, and late-payment interest runs at 0.022% per day. Delay carries a measurable cost.Rolling ISA maturity proceeds into a retirement account can add 10% of the converted amount, up to KRW 3 million, or about $2,200, to retirement-account contribution creditable amounts. What the chart says first Monthly $30K investment 20-year compound growth simulation 20-year compound-growth simulation for a $220 monthly contribution The chart below shows how wide the gap becomes after 20 years when a $220 monthly contribution compounds at 4%, 7%, and 10%. In this range, compounding and contribution duration create larger numbers than tax optimization alone. Saving about $75 in tax may matter less than keeping the contribution schedule alive for one more year. ...

April 28, 2026
Expense Ratio Compounding: 0.03% vs 0.5% Over 30 Years

Expense Ratio Compounding: 0.03% vs 0.5% Over 30 Years

A 0.47 percentage-point fee gap means 6.97% net versus 6.50% net on a 7.00% gross-return assumption.With $1,500 invested monthly for 30 years, total contributions reach $540,000 and the projected ending balance is roughly $1.74 million at 0.03% versus $1.60 million at 0.50%.The spread is about $143,000, or roughly 8% of the lower-fee ending balance, before taxes and slippage.As of Apr. 15, 2026, VOO traded near $640.44 with a 1.11% dividend yield and a 27.19 P/E, while COWZ traded near $63.02 with a 2.05% yield and a 16.77 P/E.Over the latest 5-year window cited by providers, VOO was at 12.81% annualized, SPLG at 11.42%, and COWZ at 14.61%, showing that fee alone does not explain every outcome. The fee gap that looks small until time does the math Monthly investment 20-year compound growth simulation Expense ratio is one of those numbers that looks harmless in isolation. Three basis points. Fifty basis points. That sounds like rounding error. It is not. Vanguard’s own explanation is direct: the fee is pulled from fund returns, not billed separately. That matters because the deduction happens every year, on a balance that keeps changing. ...

April 25, 2026
QQQ vs SPY 10-Year Regression: Tech Concentration vs Diversification

QQQ vs SPY 10-Year Regression: Tech Concentration vs Diversification

QQQ sits at $651.42 with a 1-year return of +44.0%, while SPY sits at $708.45 with a 1-year return of +33.8%.The 3-year cumulative gap is 30.2 percentage points: QQQ at +108.0% versus SPY at +77.8%.The 5-year cumulative gap is 15.4 percentage points: QQQ at +98.1% versus SPY at +82.7%.SPY still pays more income, with a 1.04% dividend yield versus QQQ at 0.43%, or 2.4 times as much cash yield.On an implied 5-year CAGR basis, QQQ is roughly 14.6% and SPY roughly 12.8%, which means the spread exists, but it is not huge enough to ignore regime risk. Why the 20-year savings curve matters more than the share price Monthly investment 20-year compound growth simulation The first mistake in comparing QQQ and SPY is to stare at the price tags. QQQ at $651.42 and SPY at $708.45 look like two expensive symbols, but share price is not the signal. The return path is. The 20-year monthly 300,000-won simulation inserted below this section makes the same point in a cleaner way: at 4%, 7%, and 10%, the ending values do not rise in a straight line. They accelerate. That is the compounding effect that turns a small annual edge into a large decade gap. ...

April 24, 2026
TQQQ Five-Year Drawdown and Volatility Decomposition: When 3x Trails 2x

TQQQ Five-Year Drawdown and Volatility Decomposition: When 3x Trails 2x

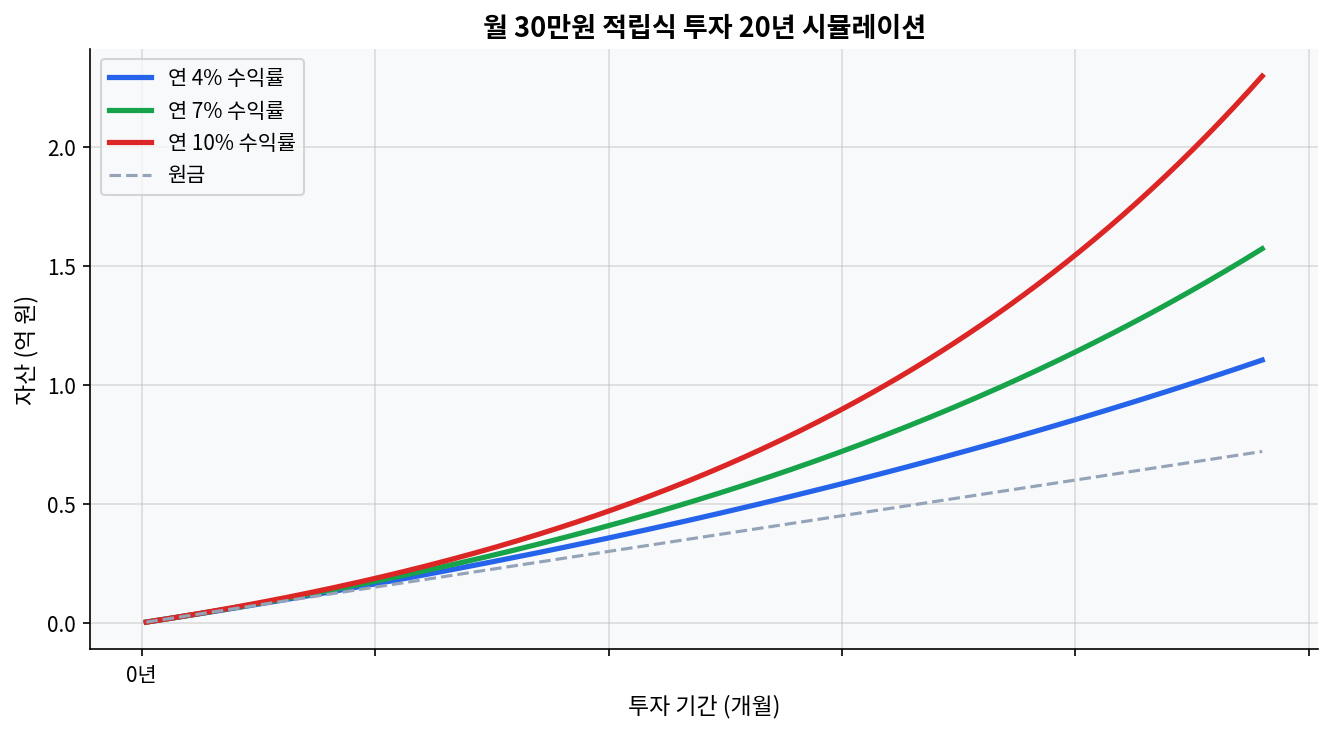
As of 2026-04-21, TQQQ’s 5-year total return was 120.40%, with a CAGR of 16.57%.As of 2026-03-31, TQQQ’s 5-year maximum drawdown was 81.65%, compared with 35.12% for QQQ.5-year annualized monthly volatility was 61.28% for TQQQ, 20.23% for QQQ, and 40.61% for QLD.Over the same 5-year window, QLD outperformed TQQQ with a total return of 137.48% and a CAGR of 18.77%.Dividend yield sat at 0.53% for TQQQ, 0.15% for QLD, and 0.43% for QQQ. For leveraged ETFs, the core driver is not cash flow but path dependency. The Two Charts Say the First Thing Comparison of how ETF fee differences affect long-term returns The first chart shows the long-run asset gap between 0.05% and 1.0% ETF fees over 20 years. The second shows how monthly $300 contributions diverge over time at 4%, 7%, and 10% annual returns. In the TQQQ discussion, those two charts are not background noise. For leveraged ETFs, cost and path shape the equity curve faster than the headline return table suggests. Even if TQQQ posts a strong 2020-2026 run, a single 2022-style collapse can damage the long-run profile in ways that are hard to reverse. ...

April 24, 2026
VOO DCA After 12 Months: Real Returns, Mistakes, and SCHD Contrast

VOO DCA After 12 Months: Real Returns, Mistakes, and SCHD Contrast

VOO sits at $651.54 with a 1-year return of +36.3%, a 3-year cumulative return of +79.0%, a 5-year cumulative return of +85.0%, and a dividend yield of 1.09%.SCHD sits at $31.03 with a 1-year return of +26.8%, a 3-year cumulative return of +41.5%, a 5-year cumulative return of +49.8%, and a dividend yield of 3.4%.Across the provided windows, VOO beat SCHD by 9.5 percentage points over 1 year, 37.5 points over 3 years, and 35.2 points over 5 years on cumulative return.The chart below tests monthly KRW 300,000 DCA over 20 years at 4%, 7%, and 10%; the gap between those paths shows how sensitive long-horizon outcomes are to small return differences.The biggest mistake in a first-year DCA window is treating a strong 12-month run as a permanent feature of the market instead of a regime that can change fast. What the 20-year DCA chart is really saying Monthly investment 20-year compound growth simulation The chart beneath this section is the cleanest reminder that monthly ETF investing is about time, not drama. A monthly KRW 300,000 plan over 20 years looks modest in year 1, then starts to separate sharply when the assumed return moves from 4% to 7%, and again from 7% to 10%. That is the core lesson. The later contributions matter less than the early contributions once compounding starts doing real work. ...

April 22, 2026