Traditional IRA vs 401(k) Tax Shield Data: Income Bracket Simulation a
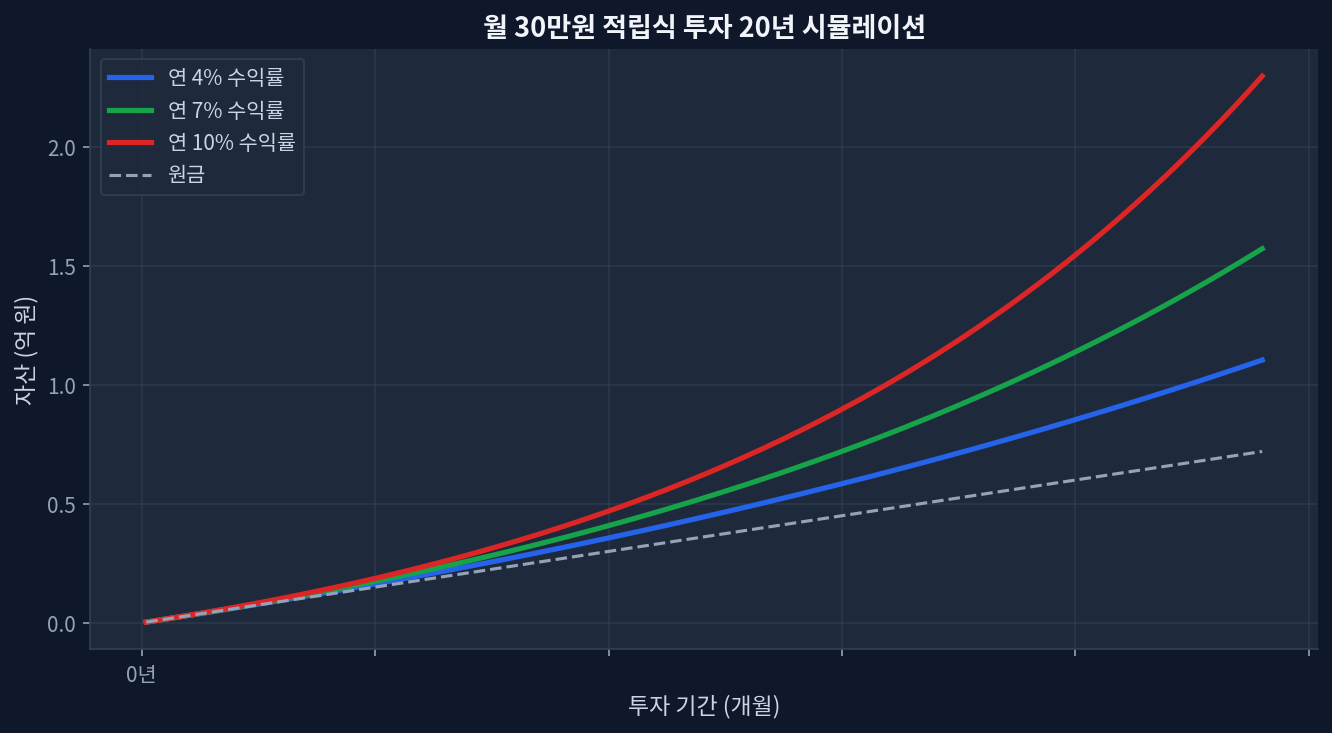
The individual retirement account (IRA) contribution limit stands at $7,000, which can generate up to $1,540 in immediate tax liability reduction for an investor in the 22% marginal tax bracket. Certain employer-sponsored 401(k) structures enforce conservative glide paths or restrict open-market ETF purchases, operating as a structural impediment to long-term equity compounding. Forfeiting the liquidity premium presents a severe risk factor. Liquidations prior to age 59.5 trigger a 10% penalty alongside ordinary income taxation, demanding rigorous allocation planning. Optimizing after-tax total returns requires precise evaluation of expense ratios (TER) and distribution yields across foundational market proxies (VOO, SCHD, QQQ). Tax-Advantaged Account Dynamics: 401(k) vs IRA Tax Shield Analysis Monthly $30K investment 20-year compound growth simulation Taxable Brokerage vs. 401(k) vs. IRA Tax Shield Comparison The mechanics of tax deferral operate as the primary acceleration engine in long-term asset accumulation. Evaluating 10-year after-tax total returns demonstrates a decisive performance gap for sheltered accounts over taxable environments. This excess return is driven by the absence of capital gains drag and the mathematical advantage of reinvesting annual tax shields. Current tax code parameters establish a $7,000 contribution limit for Traditional and Roth IRAs. Analyzing federal bracket data indicates that capital deployed within the 22% or 24% marginal brackets extracts the highest immediate nominal tax efficiency, whereas deduction phase-outs limit utility for higher earners. [IRS Contribution Guidelines] ...