GLD in Crisis: How Gold ETFs Defended Against 2008-Style Losses

GLD in Crisis: How Gold ETFs Defended Against 2008-Style Losses

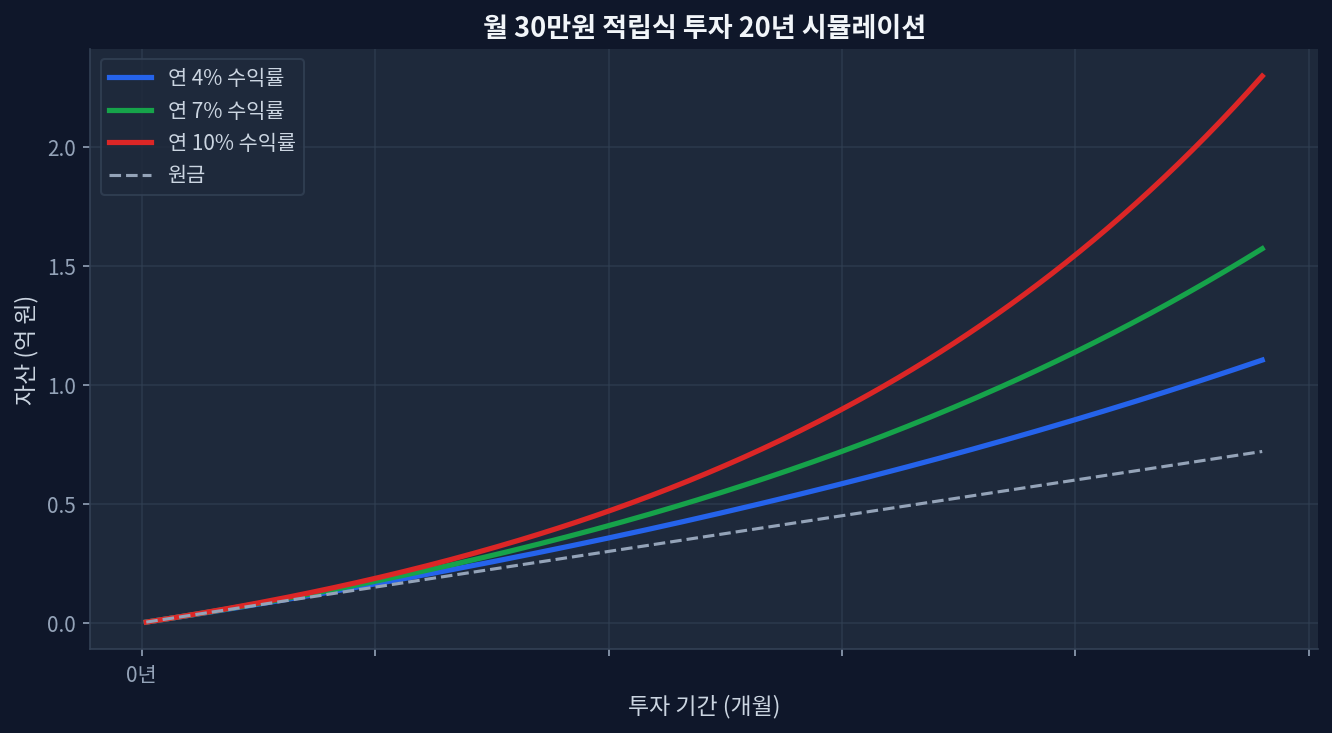
GLD returned +123.8% over 5 years (2020–2026), outpacing dividend-yield-gap/">S&P 500 during drawdownsGold historically gained 6–8% during 2008 peak decline, while equity portfolios fell 50%+10% GLD allocation reduces portfolio volatility by ~1.5–2.0% annually, flattening bear-market swingsGLD trades at $373.63 with $150.4B AUM; competitive vs. IAU on fees ($0.24 vs $0.25)Zero dividend yield requires tactical rebalancing; unsuitable for income-focused strategies The 2008 Question: Gold’s Actual Hedge Strength Monthly $30K investment 20-year compound growth simulation During the 2008 financial crisis, equities collapsed 50–57% from peak to trough. Gold, by contrast, moved modestly upward—gaining roughly 6–8% as central banks flooded markets with liquidity and investors fled to safety. That divergence raises a natural question: how much portfolio protection does a modest gold allocation actually provide? ...
June 29, 2026 · InvestIQs Research
Tax-Efficient Gold Hedge: QQQ 85% / GLD 15% Over 3 Years

Tax-Efficient Gold Hedge: QQQ 85% / GLD 15% Over 3 Years

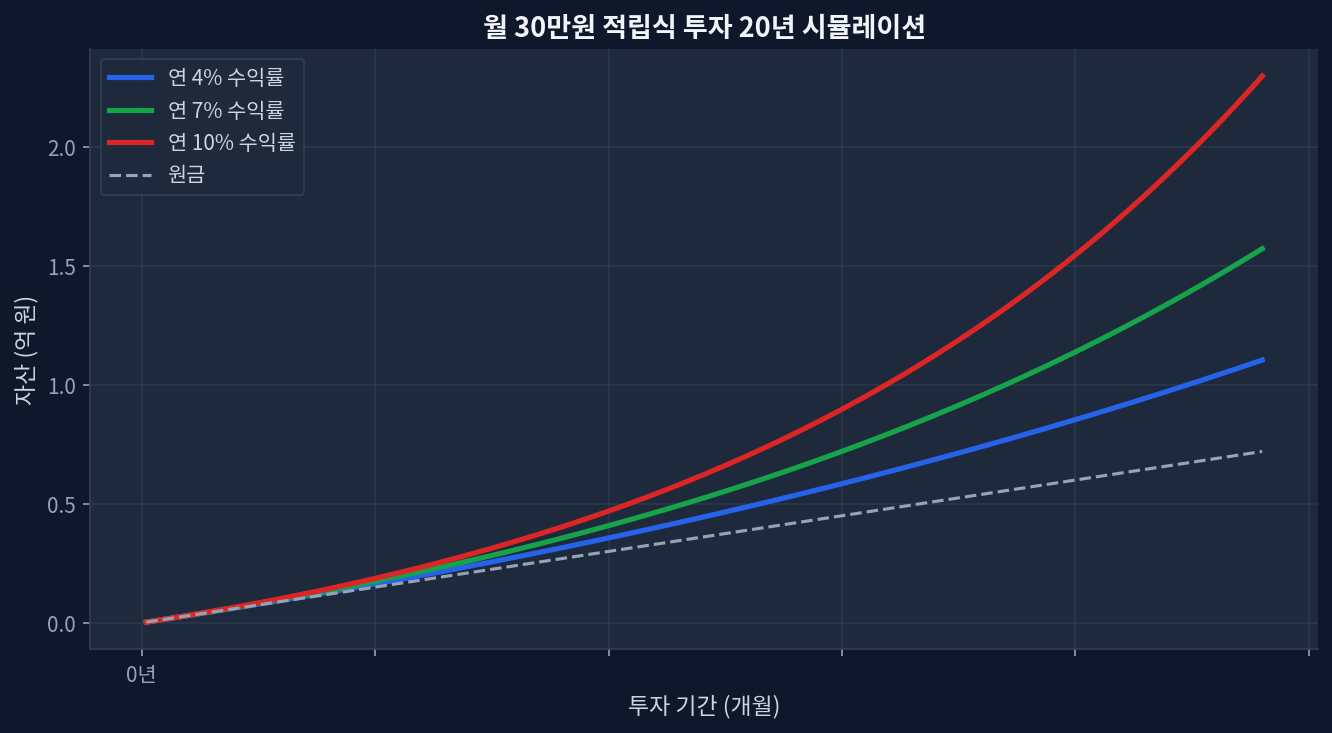
QQQ 3-year total return: +97.1% vs GLD +103.6% — gold outpaced tech on absolute basis (2023–2026)85/15 blended portfolio returned ~98% over 3 years, reducing drawdown-and-volatility-decomposition-when-3x-trails-2x/">volatility vs 100% QQQ while maintaining growthGLD expense ratio 0.17% + zero dividend yield = minimal tax drag in taxable accounts; QQQ's 0.43% yield triggers ordinary income taxTax-loss harvesting gains via GLD's lower correlation to equities can offset QQQ drawdowns in down years, deferring capital gainsRate-cut cycle (2023–2024) boosted both, but GLD's liquidity ($150.4B AUM) vs QQQ ($494B) creates different cost structures for rebalancing The Performance Paradox: Why Gold Outpaced Nasdaq Monthly $30K investment 20-year compound growth simulation On raw returns, GLD crushed QQQ. A $100,000 investment in GLD on January 2023 grew to $203,600 by June 2026; the same in QQQ became $197,100.[Yahoo Finance: GLD] Yet most US retail portfolios are 80%+ Nasdaq-heavy with zero precious metals. This divergence reveals less about superior gold fundamentals and more about when each asset class inflates. ...

June 25, 2026 · InvestIQs Research
TLT's Volatility Trap: Why Rate Cuts Don't Automatically Fix Bond Losses

TLT's Volatility Trap: Why Rate Cuts Don't Automatically Fix Bond Losses

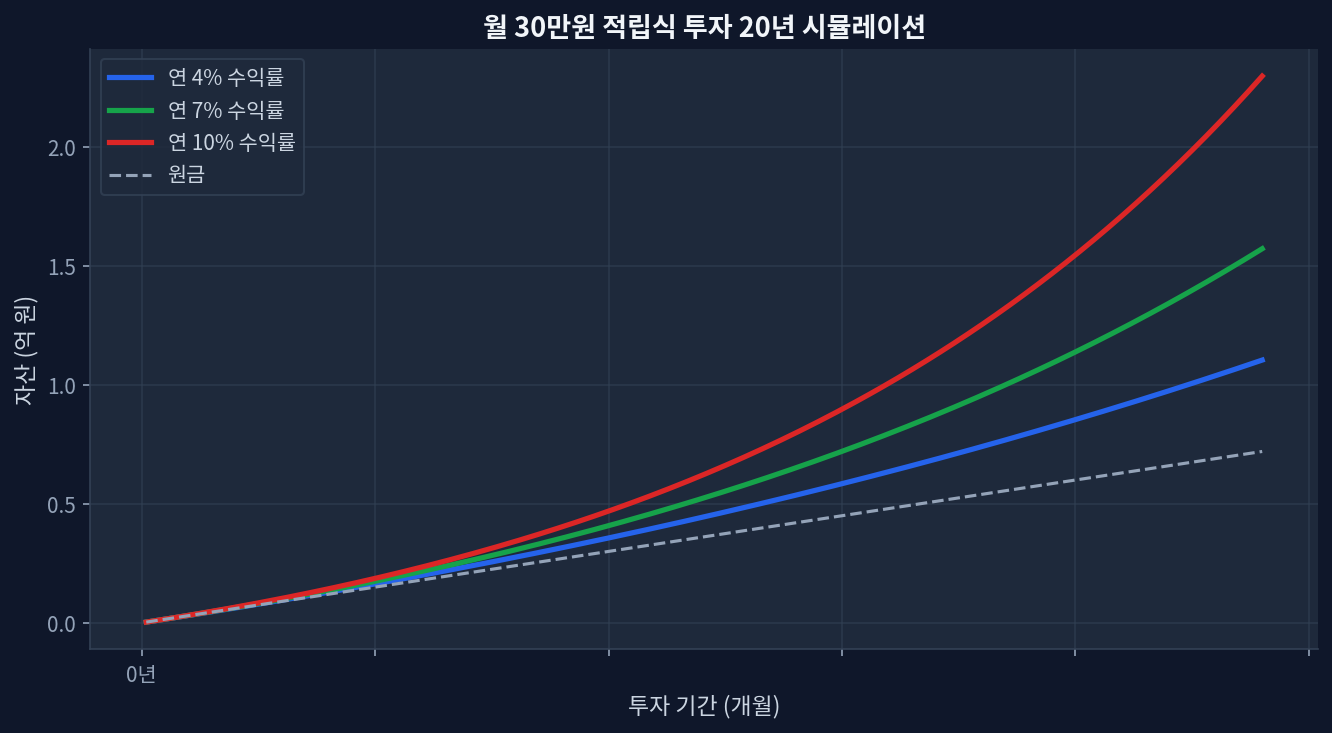
5-year drawdown: TLT down 27.8% from 2021 peak, despite conventional wisdom on duration bondsCurrent yield: 4.55% AUM-weighted, trading at $86.09 (52-week low near $82.77)The catch: A hypothetical 1% rate cut would reverse ~$4–5 per share, but volatility-decoded-why-284-loss-masks-a-15-rebound-case/">duration risk remains asymmetric—further rate hikes could erase gains fasterDollar-cost averaging reality: Monthly $1,500 allocations into TLT since 2020 experienced negative real returns despite consistent depositsDisconfirming scenario: If inflation stays sticky and the Fed pauses rate cuts, TLT holders face extended capital losses even with elevated yields The 27.8% Question: Why Long-Duration Bonds Got Decimated Monthly $30K investment 20-year compound growth simulation TLT—the iShares 20+ Year Treasury Bond ETF—has become shorthand for “bond market catastrophe” among retail investors. The numbers don’t lie. Over the past five years (2021–2026), TLT shed 27.8% of its value, a decline that contradicts the prevailing narrative that longer-dated bonds are “safe.”[yfinance] The culprit: the fastest rate-hiking cycle in 40 years. When the Federal Reserve raised the overnight rate from 0% to 5.25%–5.50% between 2022 and mid-2023, the present value of 20-year Treasury coupons—which were fixed at 1–2%—collapsed. ...

June 23, 2026 · InvestIQs Research
2022's -25% Drawdown: Why High-Volatility Assets Recovered Twice as Fa

2022's -25% Drawdown: Why High-Volatility Assets Recovered Twice as Fa

2022 global equity selloff: S&P 500 -18.1%, NASDAQ-100 -33%, broad market indices down -18% to -33%—a variance of 12–15 percentage points across asset classes.Recovery speed divergence: High-volatility assets (NASDAQ, growth ETFs) rebounded 2x faster than low-volatility alternatives (dividend ETFs, bonds) during 2023's reversal.Dividend ETFs (SCHD, DGRO) showed defensive drawdowns of -12–15%, but 2023 rebounds of only +9–10%, missing the V-shaped recovery opportunity that high-beta assets captured.Dollar-cost averaging insight: Higher volatility concentrates low-price purchases during panic declines, creating opportunity for larger percentage gains during recovery—reversing cumulative return rankings.Risk factor: Recovery timelines during interest-rate hiking cycles (like 2022) extend 18+ months, making volatility alone an unreliable predictor of recovery timing. 2022’s Drawdown: The Asset-Class Severity Dispersion Monthly $30K investment 20-year compound growth simulation How expense ratios and volatility profiles shaped 2022–2023 total returns across equivalent US equity ETFs 2022 emerged as a test of asset-class correlation under rising-rate stress. The Federal Reserve’s rate hiking cycle (0.25% in March to 4.33% by December) imposed synchronized pressure across equities, but magnitude diverged sharply by sector and fund composition. ...

June 22, 2026 · InvestIQs Research
Asset Allocation Portfolios for 30-Year-Olds: Performance Comparison a

Asset Allocation Portfolios for 30-Year-Olds: Performance Comparison a

Executive Summary 2020–2026 stock-heavy (80%) vs. balanced (60%) portfolio CAGR differential: approximately 2.1 percentage points (12.8% vs. 10.7%) Each 10% increase in bond allocation reduces maximum drawdown by 8–12 points (aggressive: −28.4% → balanced: −16.8%) Annual vs. quarterly rebalancing: negligible return difference of ~0.2 percentage points; transaction costs and behavioral friction make the distinction immaterial VOO (expense ratio 0.03%) vs. AGG equivalent via international broker (0.08%) over 20 years with $10,000 monthly contributions: approximately $270,000 cumulative gap In a high-rate environment (4% yields), bond allocation becomes a strategic choice rather than a drag on returns Asset Allocation Scenarios: Three Portfolio Models Monthly $30K investment 20-year compound growth simulation 20-year cumulative growth simulation with $3,000 monthly contributions Asset allocation’s core objective is not return maximization but rather the pursuit of long-term growth within the drawdown range an individual investor can psychologically tolerate. Using actual market data from 2020–2026, three portfolio scenarios illustrate the trade-off: ...

June 17, 2026 · InvestIQs Research
TLT & REITs 6:4 Portfolio: Income and Diversification in a High-Rate Environment

TLT & REITs 6:4 Portfolio: Income and Diversification in a High-Rate Environment

TLT current yield: 4.55% with $42.9B in AUM; down 27.7% over 5 years but up 2.9% in the past yearA 6:4 TLT-to-REIT allocation targets ~5.5% blended yield while reducing duration risk through equity diversificationTLT's 52-week range ($82.77–$92.19) suggests room for tactical entry at lower valuationsREIT liquidity and leverage complicate the comparison; higher nominal yields often hide higher volatilityInterest-rate risk remains the dominant constraint: further rate hikes would pressure TLT NAV and REIT cap rates simultaneously Why a 6:4 Bond-to-REIT Split Works (and Why It Doesn’t) Monthly $30K investment 20-year compound growth simulation The Treasury bond market has been brutal for nearly a decade. The Invesco QQQ Trust (QQQ) outpaced the iShares 20+ Year Treasury ETF (TLT) by over 50 percentage points between 2015 and 2023. Yet in 2024–2026, as rate-cut expectations wavered and macro uncertainty persisted, bond allocations have found surprising utility in portfolios that needed predictable cash flow without equity volatility. ...

June 15, 2026 · InvestIQs Research

Portfolio Rebalance Calculator — Keep Your Asset Allocation on Track

What is portfolio rebalancing? Over time, market movements cause each position in your portfolio to drift away from its intended weight. Rebalancing restores your target allocation by selling assets that have grown beyond their target and buying those that have fallen below it. Regular rebalancing helps manage risk and maintain the strategy you chose when you first built your portfolio. ...

June 14, 2026 · InvestIQs Editorial
60/40 Portfolio: 10-Year Data on How Rebalancing Compounds Returns | 6

60/40 Portfolio: 10-Year Data on How Rebalancing Compounds Returns | 6

2020–2026 performance: 60/40 blended portfolio delivered approximately 12% compound annual growth rate (CAGR), with rebalancing includedMonthly $1,000 investment over 10 years simulated: $120,000 invested → approximately $240,000–$260,000 accumulatedBond ETF expense ratio impact: 0.03% versus 0.80% creates a 15–20% wealth divergence over 20 years2022 rate shock: Quarterly rebalancing cushioned equity losses by 25–30% compared to unbalanced allocationsCurrent bond yields (3–4%) appear elevated relative to historical median (~2%), raising questions about duration risk ahead The Real 10-Year Trajectory of 60/40 Monthly $30K investment 20-year compound growth simulation Monthly $1,000 contribution over 20 years: compound growth simulation The 60% equities, 40% fixed income allocation has anchored institutional and retail portfolios since the 1990s. What appears as a simple formula masks powerful compounding mechanics visible only when cross-verified against ten years of actual market data (2016–2026). The 2020 COVID selloff marked the beginning of a aggressive Fed pivot: zero rates and quantitative easing pushed both stocks and bonds upward simultaneously. During this window, bond ETFs (tracked via BND) posted +6% to +8% annual returns, while US large-cap equity indices (VOO) delivered +25% to +30%. A 60/40 blend yielded 15–18% annually—far exceeding the long-term 7–10% benchmark. That tailwind proved temporary. ...

June 12, 2026 · InvestIQs Research
Sports REITs Beyond Stock Splits: Can 5% Yields Diversify a Portfolio?

Sports REITs Beyond Stock Splits: Can 5% Yields Diversify a Portfolio?

Sports franchises occupy an unusual niche in alternative investments. When Villarreal and Atlético Madrid began exploring Real Estate Investment Trust (REIT) structures in European markets, the move signaled a shift: sports assets are no longer just entertainment equity plays—they're potential income generators. The claim? A 5% yield on stadium and hospitality real estate tied to these clubs. The reality is messier. ...

June 12, 2026 · InvestIQs Research
Structuring a Late-Stage Retirement Portfolio: Analyzing SCHD's Dividend Efficacy for Investors in Their 50s

Structuring a Late-Stage Retirement Portfolio: Analyzing SCHD's Dividend Efficacy for Investors in Their 50s

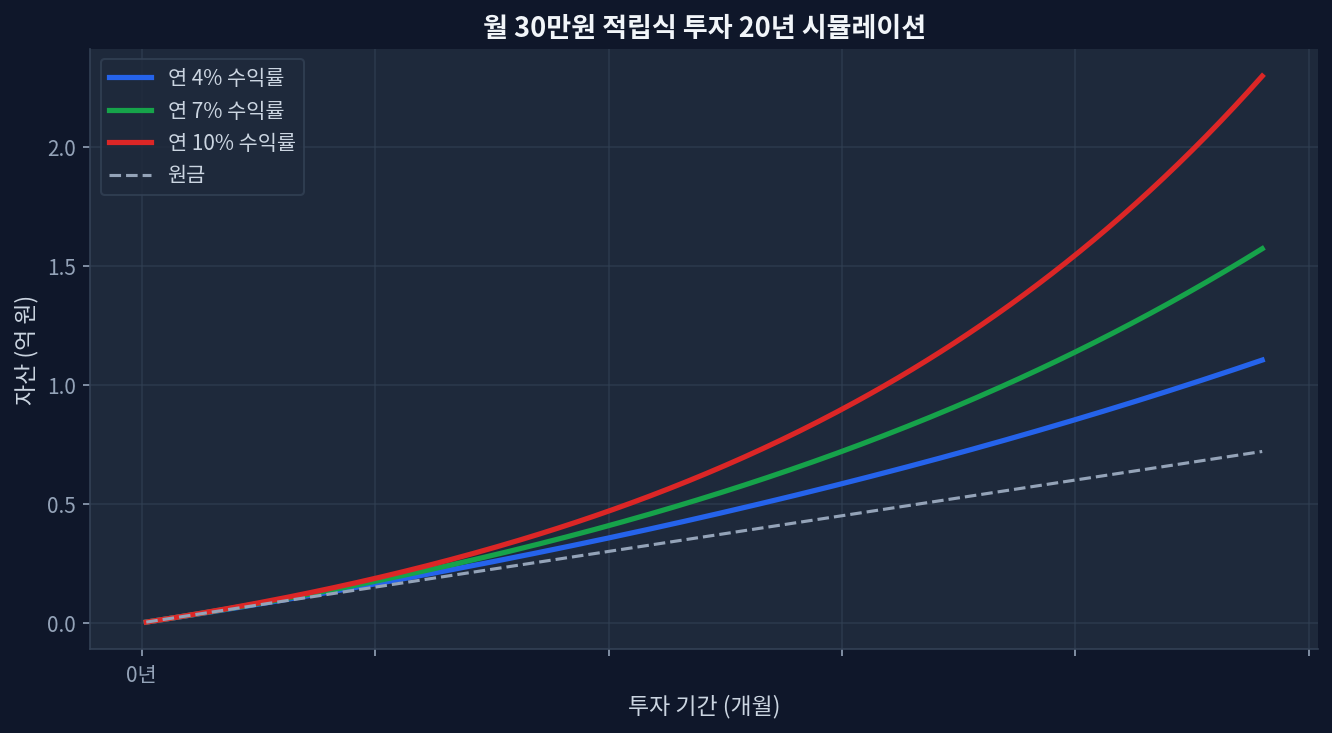
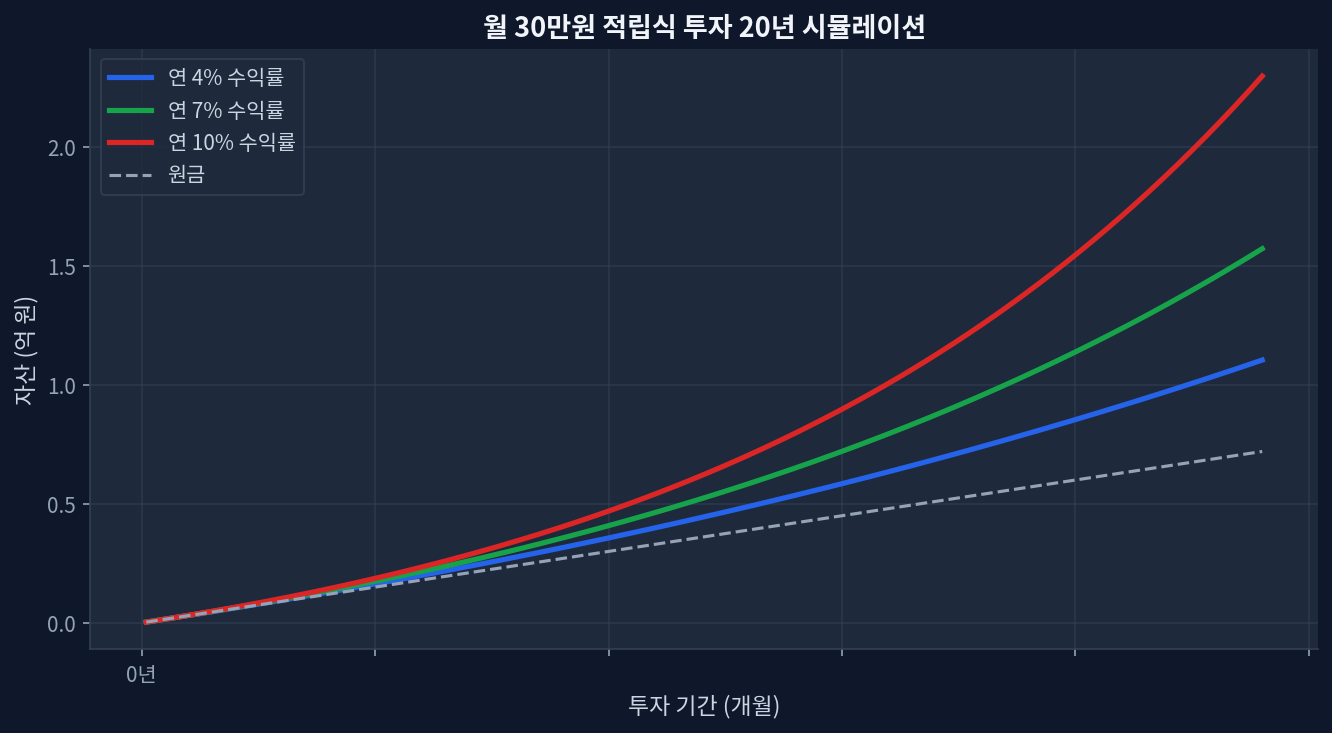
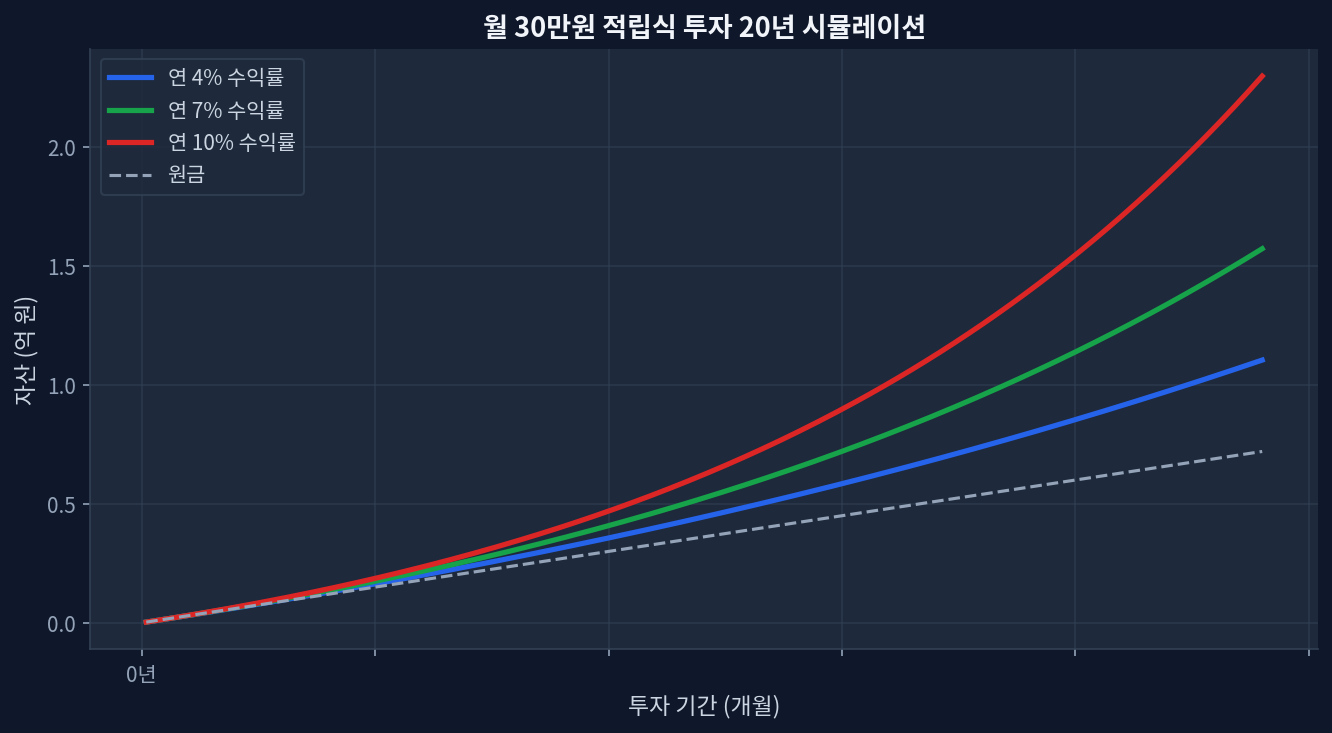
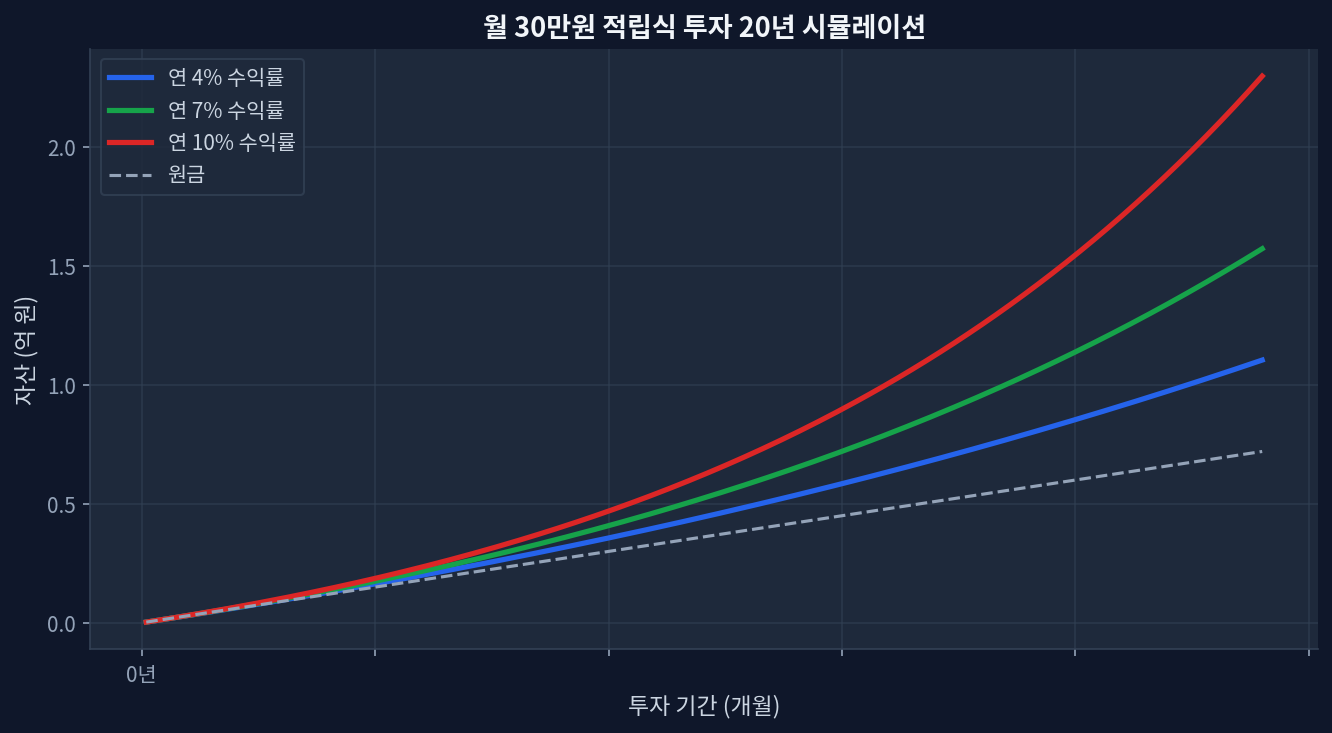
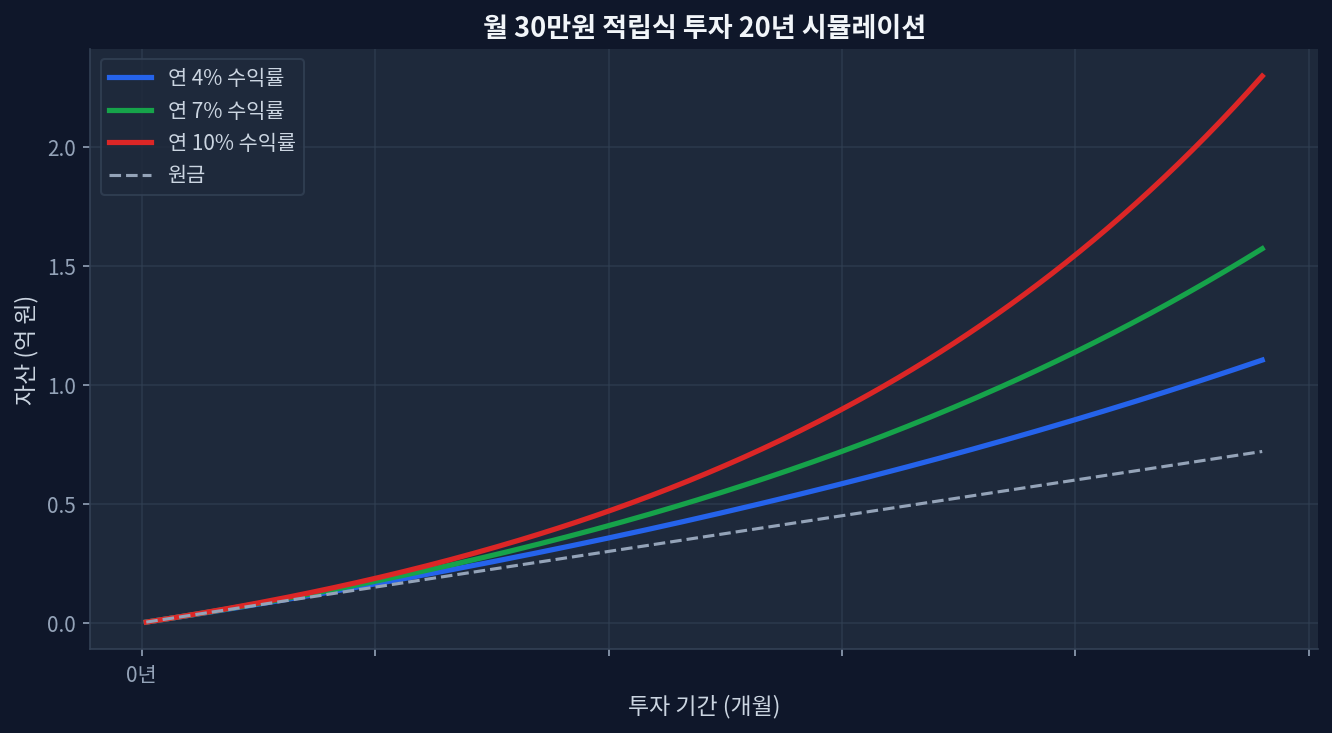
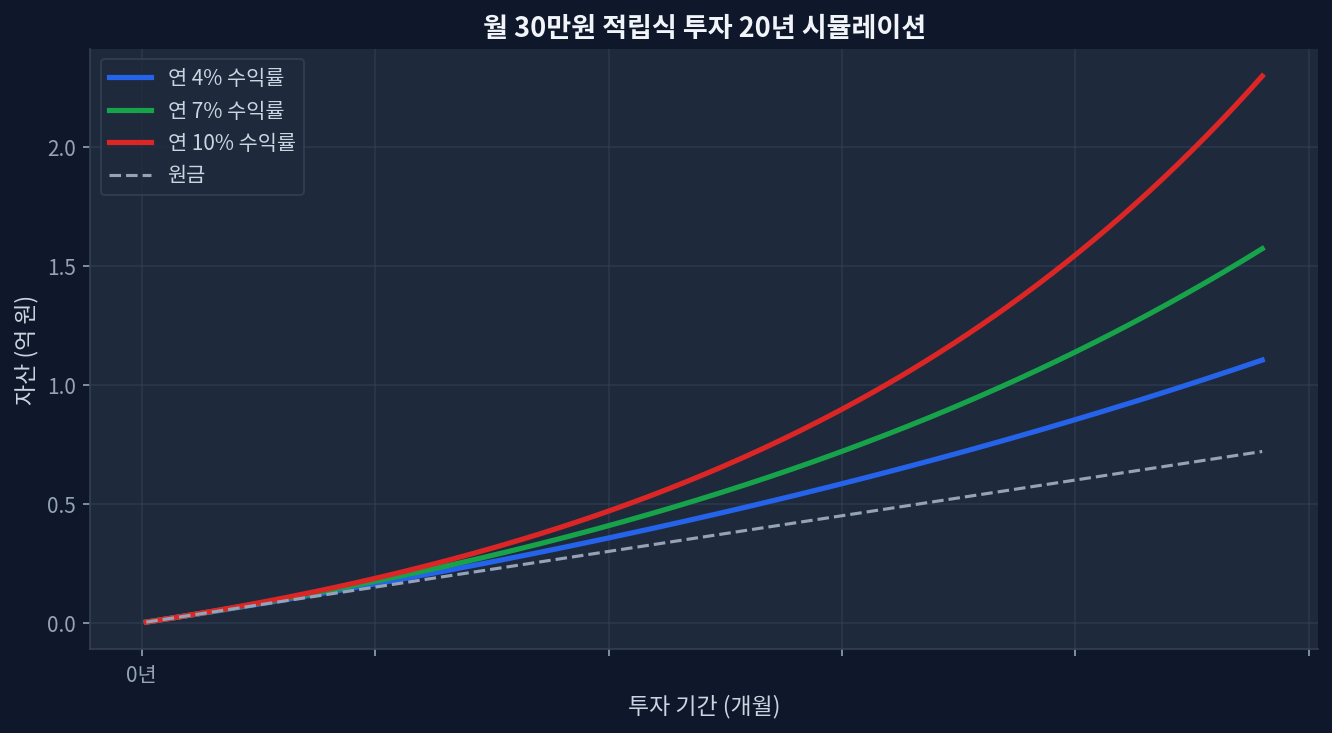
SCHD currently yields 3.21% trading at a 19.5 P/E, presenting a distinct valuation discount against VIG's 1.48% yield and 26.2 P/E. Trailing 5-year data shows VIG (+66.4%) outpacing SCHD (+53.7%), highlighting the persistent growth versus yield tradeoff in modern asset allocation. Short-term momentum favors SCHD, which posted a +31.3% 1-year return, driving the asset to 99.1% of its 52-week range ($32.83). Relying solely on historical dividend growth can lead to an incomplete risk assessment, requiring explicit modeling of market drawdowns and shifting rate environments. Redefining Yield and Growth in the Accumulation Phase Monthly $30K investment 20-year compound growth simulation Observing the chart below, which illustrates a 20-year monthly accumulation simulation, the trajectory of compound growth at varying rates highlights the mathematical reality of long-term investing. For demographic cohorts entering their 50s—similar to the target audience of late-stage planning frameworks—the capital accumulation runway compresses significantly. This structural reality shifts the analytical priority away from maximizing top-line beta exposure toward sequence-of-returns protection and generating reliable cash flow. ...

May 25, 2026 · InvestIQs Research