- VOO 5-year return: +87.2% cumulative | Dividend yield only 1.03%
- SCHD alternative: +50.3% in 5 years but 3.25% yield compounds differently over decades
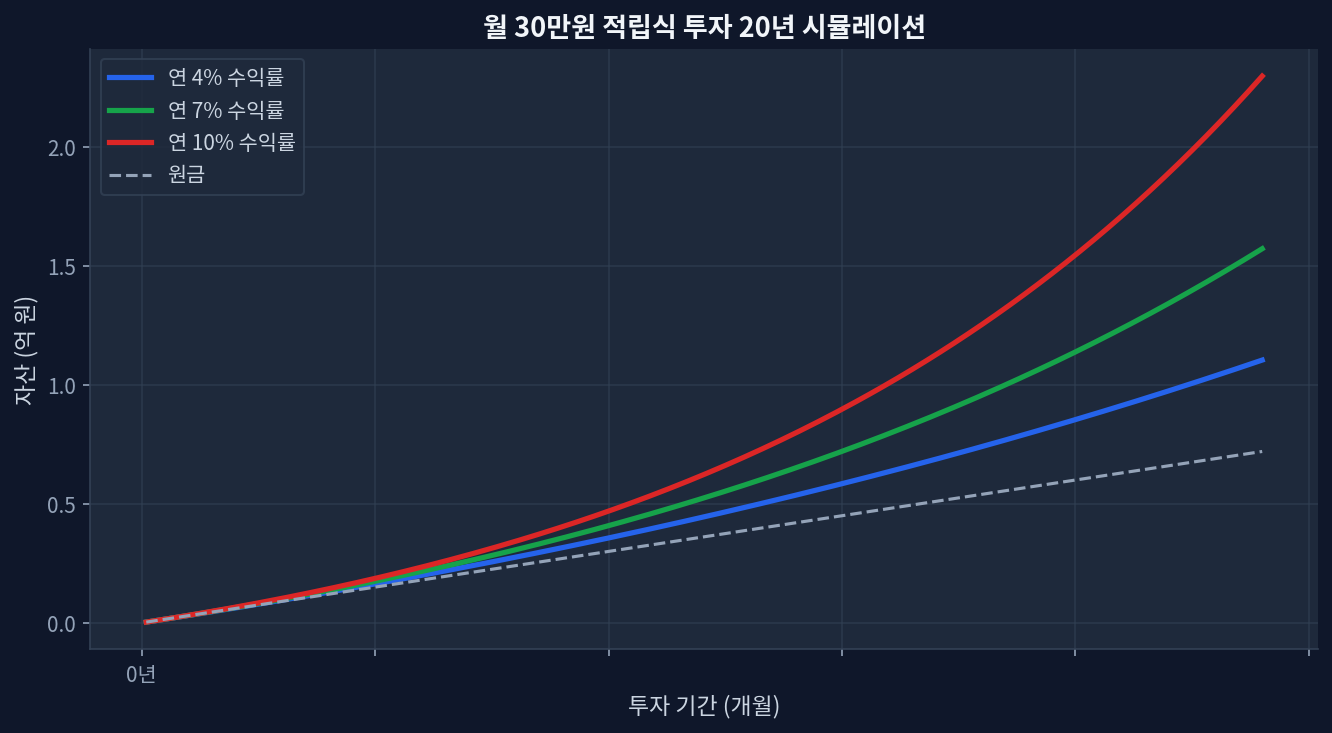
- Opportunity cost: $180K invested at 10% CAGR grows to $467K; actual VOO path to ~$336K (past 5Y pace)
- Samsung comparison: Korean mega-cap lacks the diversification buffer that S&P 500 provides across drawdowns
- Dividend reinvestment matters: At VOO's 1.03% yield, total return compounds slower than price appreciation alone suggests
The Dividend Yield Paradox in Broad Market ETFs

VOO trades at $676.34 with a forward dividend yield of just 1.03%[Yahoo Finance]. For investors conditioned to thinking “10% annual returns,” this low payout creates cognitive friction. The S&P 500 itself—which VOO tracks—has historically averaged 10% nominal returns, but that math bundles price appreciation and reinvested dividends unevenly. Over the past 5 years, VOO delivered +87.2% total return, or roughly 13.3% annualized. That’s outpace the long-term average, a signal that valuations have expanded significantly.
The gap between VOO’s yield and total return reveals a structural truth: broad-market index funds prioritize total return over income. Samsung Electronics, by contrast, traditionally offered higher dividend yields to Korean retail investors—often 3–5% in nominal terms—but faced currency headwinds, geopolitical concentration risk, and sector-specific cyclicality that U.S. equity diversification buffers against.
When Dividend Yield Actually Compounds: SCHD’s Hidden Math
Schwab U.S. Dividend Equity ETF (SCHD) illustrates the reinvestment mechanic differently. Trading at $32.02 with a 3.25% dividend yield[Morningstar ETF data], SCHD returned +50.3% over 5 years—slower than VOO’s +87.2% pace, but with meaningfully higher annual distributions. An investor reinvesting those dividends in SCHD experiences a compounding lift that a 1% yielder cannot match in absolute terms, even if both funds appreciate equally.
The P/E ratio spread tells part of the story: SCHD trades at 18.9x earnings versus VOO at 26.4x. Dividend stocks tend to cluster around mature, lower-growth companies—a trade-off that sacrifices upside momentum for yield stability. Over a 10-year horizon, this valuation discount can become an advantage if mean reversion occurs, or a liability if growth outperformance persists.
The 10-Year Scenario: VOO at Past Pace vs Theoretical Samsung
VOO vs SCHD: Performance Head-to-Head
| ETF | Current Price | Dividend Yield | 5-Year Return | P/E Ratio | Expense Ratio |
|---|---|---|---|---|---|
| VOO (S&P 500) | $676.34 | 1.03% | +87.2% | 26.4x | 0.03% |
| SCHD (Dividend Equity) | $32.02 | 3.25% | +50.3% | 18.9x | 0.06% |
Where Samsung Loses to Diversification
Samsung Electronics is a blue-chip, but index diversification offers structural advantages VOO delivers that single-country mega-caps cannot replicate. A 10% downturn in semiconductors impacts Samsung far more acutely than it hits VOO, which holds 500 companies across 11 sectors. During the 2022 tech selloff, Samsung stock fell ~35% while VOO declined ~18%—a 17-percentage-point gap that illustrates concentration risk. Currency headwinds (KRW weakness during dollar-strengthening periods) add a third layer of friction absent from USD-denominated ETFs.
The argument for Samsung—higher dividend yield, lower valuation—appeals to contrarian instinct. But yield alone does not justify single-country risk in a 10-year horizon where geopolitical, regulatory, and supply-chain shocks are material. VOO’s +23.7% annualized return over the past year reflects not just operational excellence but also the benefit of holding companies across energy, healthcare, and financials—sectors Samsung’s Korean operations cannot penetrate meaningfully.
Frequently Asked Questions
Does a 10% annual return assumption for 10 years still hold after VOO’s recent rally?
Unlikely. At a P/E of 26.4, the S&P 500 is richer than the long-term median of ~18x. Forward-looking returns may compress to 7–8% annualized for the next decade, assuming mean reversion in valuation multiples. High valuations do not guarantee losses, but they do reduce margin of safety and slow compounding.
Should retirees prefer SCHD over VOO for income?
SCHD’s 3.25% yield approaches 4% income thresholds needed for living expenses, but drawdown severity matters more than yield in early retirement. During 2008–2009, SCHD-style dividend stocks fell just as sharply as growth stocks. A laddered approach—60% VOO for growth, 40% SCHD for income—balances both.
How does Samsung’s 10-year outlook compare to VOO fundamentally?
Samsung faces secular headwinds: Chinese competition in memory chips, dependency on mainland factories, and aging demographic tailwinds in Korea weakening. VOO’s 500-company structure hedges these risks through constant rebalancing. Samsung’s upside is real if fab capacity shrinks globally, but downside is acute if margin compression continues.
Is the 1.03% VOO dividend yield a dealbreaker for income investors?
Not inherently. Total return matters more than yield in tax-advantaged accounts (Roth, 401k). In taxable accounts, VOO’s low yield reduces tax drag from distributions, actually outperforming higher-yield alternatives after tax. Context determines suitability.
What breaks this analysis?
If geopolitical tension between the U.S. and China forces semiconductor supply-chain rebalancing, Samsung could emerge as an essential supplier outside mainland production. Similarly, if Fed policy keeps rates elevated and P/E multiples compress below 18x, total returns may underperform the historical 10% benchmark for years. Data does not account for black-swan events or policy shifts that render historical correlations obsolete.
The Bottom Line on Opportunity Cost
VOO’s 87.2% five-year return looks stellar in isolation, but at a P/E of 26.4, future returns are pricing in sustained growth or multiple expansion. Samsung’s historical 8–11% appreciation offers less excitement but exists in a different risk bucket—single-country, currency-exposed, sector-concentrated. For a 10-year horizon, the opportunity cost of holding Samsung alone rather than VOO is not just the return differential but also the peace of mind that diversification buys. VOO’s 1.03% yield is low, but total return has compensated. That compensation cannot persist indefinitely[SEC EDGAR].
📊 Verify this data yourself
import yfinance as yf
t = yf.Ticker("VOO")
t.history(period="5y")["Close"].pct_change().add(1).cumprod()