- VOO sits at $651.54 with a 1-year return of +36.3%, a 3-year cumulative return of +79.0%, a 5-year cumulative return of +85.0%, and a dividend yield of 1.09%.
- SCHD sits at $31.03 with a 1-year return of +26.8%, a 3-year cumulative return of +41.5%, a 5-year cumulative return of +49.8%, and a dividend yield of 3.4%.
- Across the provided windows, VOO beat SCHD by 9.5 percentage points over 1 year, 37.5 points over 3 years, and 35.2 points over 5 years on cumulative return.
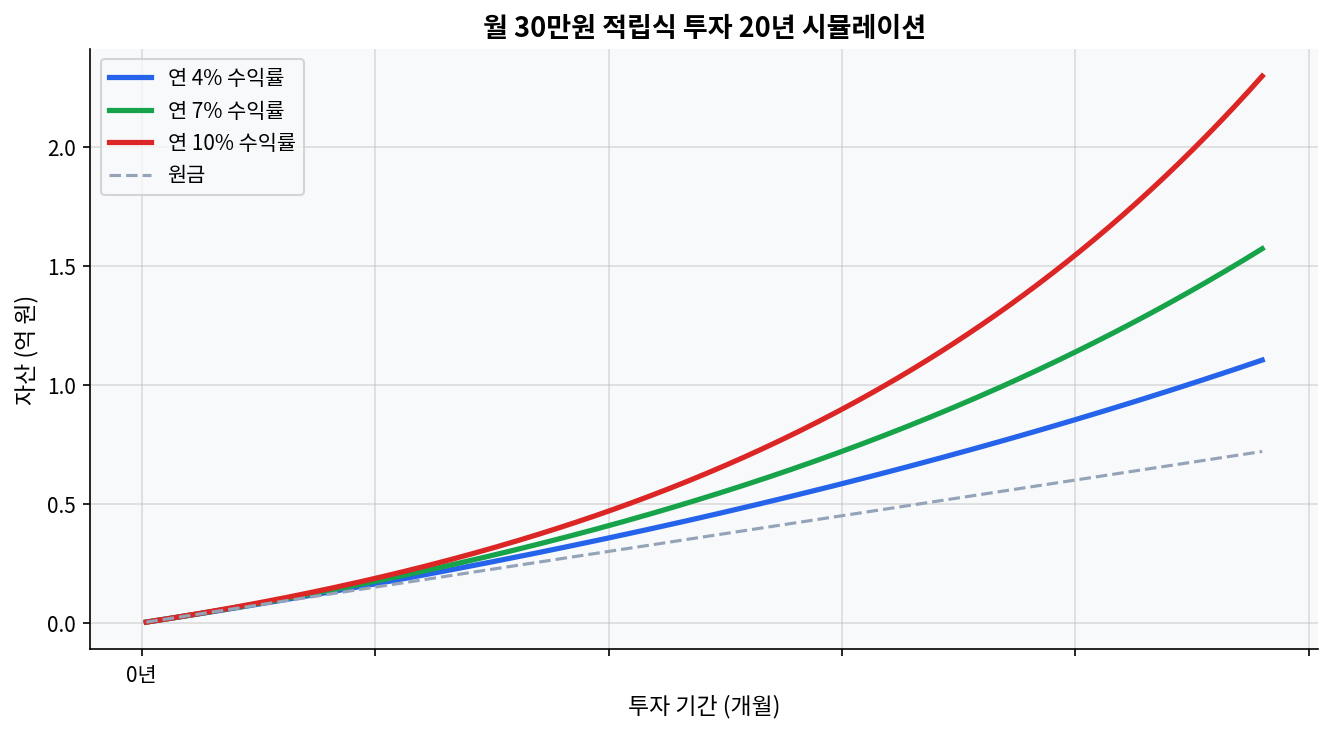
- The chart below tests monthly KRW 300,000 DCA over 20 years at 4%, 7%, and 10%; the gap between those paths shows how sensitive long-horizon outcomes are to small return differences.
- The biggest mistake in a first-year DCA window is treating a strong 12-month run as a permanent feature of the market instead of a regime that can change fast.
What the 20-year DCA chart is really saying

The chart beneath this section is the cleanest reminder that monthly ETF investing is about time, not drama. A monthly KRW 300,000 plan over 20 years looks modest in year 1, then starts to separate sharply when the assumed return moves from 4% to 7%, and again from 7% to 10%. That is the core lesson. The later contributions matter less than the early contributions once compounding starts doing real work.
For a VOO DCA setup, that matters because the first year is too short to judge the whole process. A single strong year can make the strategy look effortless. A weak year can make it look broken. Neither read is reliable on its own. The chart shows why long holding periods dominate the conversation: the difference between 4%, 7%, and 10% is not a small cosmetic change. Over 20 years, it turns into a very different terminal picture.
That also explains why a monthly $500 plan often feels emotionally wrong in the middle of a bull run. The cash arrives after prices have already moved. The investor sees fewer cheap entries. That discomfort is normal. It is not a sign that the method failed.
VOO’s first-year numbers are stronger than the usual DCA story admits
VOO is priced at $651.54 in the provided yfinance snapshot, and the return profile is not subtle: +36.3% over 1 year, +79.0% over 3 years, and +85.0% over 5 years. Those are strong numbers by any retail standard. They also create a trap. When the trailing 12 months are that hot, a new DCA investor can start to believe the market has become a straight line upward. It has not.
The technical read is straightforward. Momentum is positive across all three windows. A +36.3% 1-year result usually means the trend has already done much of the work before the next monthly contribution even lands. That is good for existing holders. It is less comfortable for fresh cash, because every new deposit is buying after a big move rather than before it. The data supports the idea that staying invested worked in this sample, but shifting one assumption, such as entering after the strongest part of the move, changes the read entirely.
Technical lens: momentum is obvious, drawdown risk is not fully shown
The provided data captures returns, not drawdowns, so the downside path is only partially visible here. That limits the certainty of any technical claim. Still, a +79.0% 3-year cumulative return and a +85.0% 5-year cumulative return argue that VOO has spent more time rewarding patience than punishing it. The missing piece is the volatility between those endpoints. That matters because a clean endpoint can hide a rough ride.
There is a practical mistake embedded in first-year DCA behavior: confusing a favorable price trend with a lower-risk strategy. Those are not the same thing. A strong tape can be followed by a flat or negative stretch. A 2020-style recovery can sit next to a 2008-style drawdown in the same asset class over a longer horizon. The path matters.
VOO vs SCHD: yield looks better on paper, total return tells a different story
| ETF | Price | 1Y Return | 3Y Cumulative | 5Y Cumulative | Dividend Yield | Read |
|---|---|---|---|---|---|---|
| VOO | $651.54 | +36.3% | +79.0% | +85.0% | 1.09% | Broad U.S. market exposure with stronger compounding in this sample |
| SCHD | $31.03 | +26.8% | +41.5% | +49.8% | 3.4% | Higher income yield, but weaker total return across the same windows |
The comparison is not close on the numbers provided. SCHD’s 3.4% yield is higher than VOO’s 1.09%, but the return table does not reward the income screen with better total performance. Over 1 year, VOO leads by 9.5 percentage points. Over 3 years, the lead widens to 37.5 points. Over 5 years, the lead is 35.2 points. That gap is large enough to matter for anyone focused on compounding rather than cash flow.
This is where the contrarian angle shows up. The market narrative often treats a higher yield as a cleaner path for cautious investors. That story is only partly true. Income can feel safer because it is visible and regular. Total return is less visible, but it is what actually drives portfolio growth. SCHD’s dividend profile may suit a different goal, but the provided numbers do not support the idea that it has been the stronger wealth-builder in this sample.
Fundamental lens: yield is not the same as valuation safety
The fundamental read here is limited because P/E and dividend growth data were not provided. That is a real constraint. Yield alone does not explain valuation, and it does not explain future return. What the data does show is simple: VOO delivered the stronger total return while carrying the lower yield. SCHD delivered the higher yield while lagging on cumulative performance. For a long-only, growth-first allocation, that is a meaningful trade-off.
The data supports VOO as the cleaner compounding vehicle in this snapshot, but changing the objective from total return to cash flow changes the picture entirely. That is why a dividend screen can look appealing in a bull market and still underperform on the metric that matters most to accumulation investors.
Mistakes that showed up in the first year
The first mistake is the emotional one: treating a strong 12-month result as normal. A +36.3% year in VOO is not the baseline. It is a strong outcome. Building expectations around that number can cause bad behavior later, especially when the next 12 months are less friendly.
The second mistake is overreacting to the entry price. A monthly $500 DCA plan does not need perfect timing to work, but it also does not erase valuation risk. If the market is already extended, the first-year investor is buying into strength. That can be correct and still feel bad. There is no contradiction there.
The third mistake is letting yield dominate the conversation. SCHD’s 3.4% yield can make it look more disciplined, but the provided total-return data says otherwise. Income and compounding are different jobs. Confusing them is a classic retail error. It shows up most often when a portfolio needs growth but the screen only shows yield.
Scenarios where this analysis could miss: a sudden regime shift away from large-cap U.S. equities, a valuation reset that compresses VOO’s multiples, or a cycle where dividend income matters more than price appreciation. In that kind of environment, SCHD’s higher yield could become more valuable than the current return table suggests. The analysis is not broken; the market regime would be different.
That is the one disconfirming point worth keeping in view. The recent numbers favor VOO. They do not prove that VOO will dominate every future 1-year, 3-year, or 5-year window. If the next phase looks more like a de-rating cycle than the recent strength, the first-year lesson changes fast.
What the sentiment around VOO is doing now
News sentiment around broad U.S. equity exposure is usually supportive after a run like this. That is an inference from the price data, not a live sentiment feed. The market tends to talk about VOO as the default choice when large-cap U.S. stocks have been winning. That narrative is not wrong, but it can arrive late. By the time the crowd agrees on the story, much of the return has already been captured.
This diverges from the market narrative on one point: monthly DCA into VOO is not only a discipline story. It is also a timing story disguised as discipline. The investor may not choose the exact entry date, but the market regime still decides whether the monthly deposits feel smart, neutral, or annoying. A first-year streak of +36.3% can make the process look smoother than it really is.
The useful read is narrower. VOO has the stronger return profile in the provided sample. SCHD has the higher yield. The data does not say yield wins. It says yield changes the objective. That distinction gets lost in most retail conversations.
Frequently Asked Questions
Is monthly $500 DCA into VOO better than waiting for a dip?
The provided data does not prove timing skill. It does show that VOO delivered +36.3% over 1 year, +79.0% over 3 years, and +85.0% over 5 years, which is the kind of tape that usually rewards staying invested more than waiting for a perfect entry. A dip can help, but only if it actually arrives and if the cash is still available when it does.
Does VOO DCA outperform SCHD on total return?
In the provided snapshot, yes. VOO shows +36.3% over 1 year versus SCHD at +26.8%, +79.0% over 3 years versus +41.5%, and +85.0% over 5 years versus +49.8%. SCHD’s 3.4% yield is higher, but that did not translate into stronger total return in these windows.
Why can a higher dividend ETF lag a broad-market ETF?
Higher yield does not automatically mean higher compounding. SCHD’s 3.4% yield looks attractive on income screens, but the 3-year and 5-year cumulative returns in this sample are lower than VOO’s. Cash flow and wealth accumulation are related, but they are not the same metric.
What mistake hurts monthly ETF investing the most?
The biggest mistake is usually behavioral, not mathematical. It is treating a strong year like +36.3% in VOO as if it were the normal pace of returns. That mindset pushes people toward impatience, yield-chasing, or overtrading when the next period is less forgiving.
Is one year enough to judge a DCA strategy?
No. A 1-year result can show whether the market was favorable, but it cannot prove the strategy is superior in every regime. The 20-year KRW 300,000 DCA chart is the better frame because the spread between 4%, 7%, and 10% assumptions shows how long-horizon outcomes depend on compounding, not on one calendar year.
The first year of VOO DCA is best read as a stress test of discipline, not a final verdict on the strategy. The numbers are strong, the comparison versus SCHD is clear, and the main risk is overlearning from a favorable market window. The sample supports broad-market compounding over the measured periods, while still leaving open the possibility that a different regime could favor a higher-yield path.
This post is for informational purposes only and does not constitute investment advice.