
- As of 2026-04-21, TQQQ’s five-year total return was 120.40%, with a CAGR of 16.57%.
- As of 2026-03-31, TQQQ’s five-year maximum drawdown was 81.65%, versus 35.12% for QQQ, or 2.33x deeper.
- Five-year annualized monthly volatility came in at 61.28% for TQQQ, 20.23% for QQQ, and 40.61% for QLD.
- Over the same five-year window, QLD outpaced TQQQ with a 137.48% total return and an 18.77% CAGR.
- Dividend yield was roughly 0.53% for TQQQ, 0.15% for QLD, and 0.43% for QQQ, which is why the real story in leveraged ETFs is path dependence, not cash flow.
The Two Charts Say It First

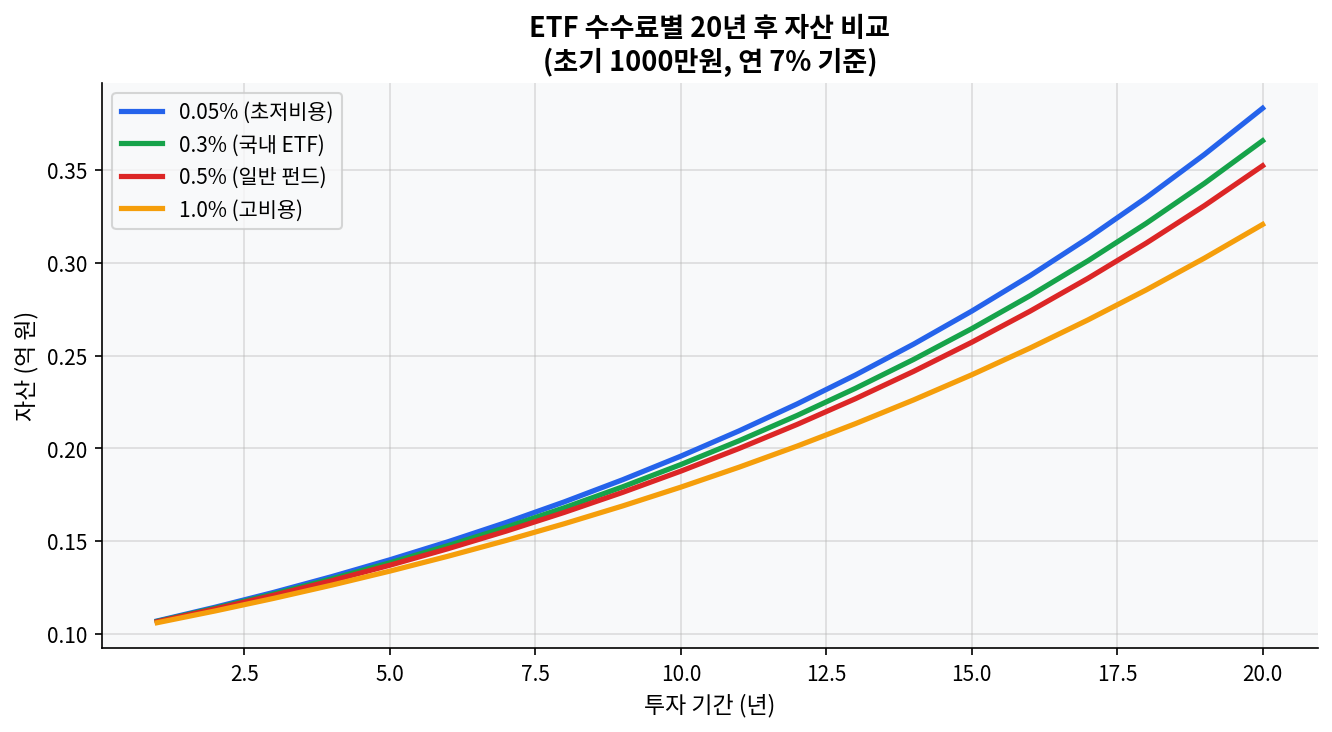
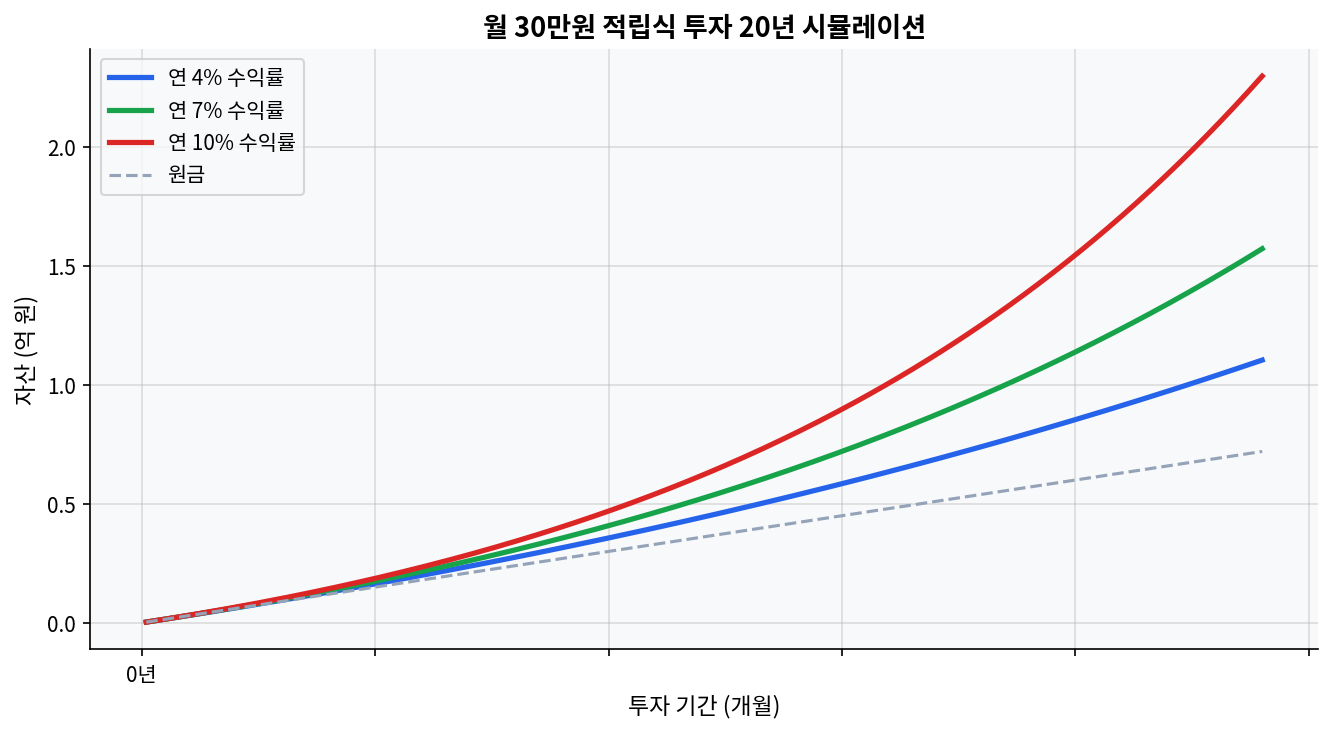
The first chart shows the 20-year wealth gap between a 0.05% ETF fee and a 1.0% fee. The second shows how monthly investing of $300 compounds very differently at 4%, 7%, and 10% over time. In a TQQQ discussion, those charts are not background material. For leveraged ETFs, costs and path shape the capital curve faster than the return table suggests. Even when TQQQ rallies hard between 2020 and 2026, the first question is how much damage a single 2022-style crash can do to the long-term line.
As of 2026-04-22, TQQQ traded at $59.58, with a 52-week range of $20.12 to $60.69 and a beta of 3.53. On the surface, that looks like a strong trend near the highs. Read differently, it also signals that downside sensitivity remains elevated near the top of the range. For leveraged ETFs, volatility density matters more than direction alone.
What the Five-Year Numbers Filter Out
The market narrative is often simple: 3x leverage should eventually deliver roughly 3x better long-term results. The 2021-2026 record pushes back on that assumption. Based on FinanceCharts data, TQQQ’s five-year total return on 2026-04-21 was 120.40%, with a CAGR of 16.57%. Over the same period, QLD returned 137.48% with an 18.77% CAGR, while QQQ returned 95.69% with a 14.16% CAGR. The 3x product did not beat the 2x product. That is the core issue. The consensus says 3x is stronger, but the actual five-year path made 2x more efficient.
The yearly path explains why. TQQQ fell 79.09% in 2022, then gained 198.04% in 2023, 58.28% in 2024, 34.35% in 2025, and 9.06% year to date in 2026. The sequence makes the point plain. A large gain is not enough if the drawdown in the middle is deep enough to break the base for compounding. QQQ, by contrast, posted -32.58% in 2022, then +54.86% in 2023, +25.58% in 2024, +20.77% in 2025, and +5.02% year to date in 2026. Same Nasdaq-100 family, completely different path magnitude.
The nonstandard read is straightforward. On the 2021-2026 data alone, TQQQ is not a simple superior version of QQQ, and there are real stretches where it is less efficient than QLD as well. The lever itself matters less than the speed at which volatility drag eats returns. In this five-year window, the idea that a 3x ETF is always stronger on a long horizon does not hold.
The Meaning of an 81.65% Drawdown
YCharts shows TQQQ’s five-year maximum drawdown at 81.65%. QQQ’s was 35.12%, and QLD’s was 63.68%. On a simple basis, TQQQ’s drawdown was 2.33x deeper than QQQ’s and 1.28x deeper than QLD’s. The more important point is the time embedded in that number. Deeper drawdowns require nonlinearly larger rebounds to recover. A 50% loss needs a 100% gain to get back to even. An 80% loss needs 400%. TQQQ’s -81.65% is not just a large loss; it is a structurally different recovery problem.
The 2022 tape shows the structure clearly. TQQQ lost 79.09% that year, QLD lost 60.52%, and QQQ lost 32.58%. Even within the same Nasdaq-100 theme, leverage drastically lengthens the recovery clock. The 2023 rebound eventually repaired the picture, which is why the 2025-2026 figures look healthier. Without that rebound, the 2022 damage would have lingered much longer. In drawdown phases, the first question is not how fast the fund can rise. It is how far the fund is allowed to fall.
That matters for behavior too. A 79.09% annual loss is hard to tolerate even in an accumulation plan. Cost-averaging can lower basis, but it does not erase drawdown. A common mistake with leveraged ETFs is entering on the back of a strong return chart, then failing to endure the -50% to -80% volatility band and cutting the plan early. At that point, long-term performance breaks at the behavior layer, not the math layer.
Volatility Breakdown: Not 3x, but 3 Layers of Risk
1. Leverage
As of 2026-03-31, TQQQ’s five-year annualized monthly volatility was 61.28%. QQQ stood at 20.23%, and QLD at 40.61%. On a simple ratio basis, TQQQ ran at 3.03x QQQ’s volatility and about 2.01x QLD’s. The daily 3x structure carried through almost directly into the longer-horizon monthly figure. The danger is simple: expected return gets mentally scaled by 3x, but volatility also scales close to 3x.
2. Valuation
Fundamentals sit quieter, but they still weigh on results. According to ProShares, Nasdaq-100’s P/E on 2026-03-31 was 31.84, with a 0.69% yield. QQQ’s current P/E was 34.13, with a 0.43% yield. TQQQ itself is built on swaps and futures exposure, so a standard P/E is not meaningful at the fund level. That means TQQQ’s profit and loss track index valuation compression and expansion, plus daily volatility, much more than any individual company’s earnings line. In a 30x-plus multiple regime, adding 3x daily leverage makes upside fast and corrections rough.
3. News Sentiment
In 2026, leveraged ETFs and options-linked products continue to draw retail attention. Liquidity is not the issue. TQQQ’s 30-day median bid-ask spread was 0.02%, which is tight. But liquidity and successful use are different things. News flow can make trading easier, but it does not change the math of leverage. More inflows can improve short-term price action, yet they do not reduce drawdowns in a 2022-style selloff. Sentiment can lift the product, but the path still decides the outcome.
There is also a clear case where this analysis could be wrong. If 2023-2026-style low-volatility uptrends persist, TQQQ can once again outperform the 2x product. TQQQ’s three-year total return was 342.39%, far ahead of QQQ’s 107.12%. That is the key counterexample. TQQQ is not a bad asset in absolute terms. It is an asset whose edge depends on the market regime.
This diverges from the market narrative on 3x leverage being automatically superior. The data supports that view only when the trend is strong enough and uninterrupted enough. Shift one assumption, and the read changes entirely: a choppy regime turns leverage from an accelerant into drag.
Peer Comparison
| Fund | Expense Ratio | Dividend Yield | 5-Year Total Return | 5-Year CAGR | 5-Year Max Drawdown |
|---|---|---|---|---|---|
| TQQQ | 0.82% | 0.53% | 120.40% | 16.57% | 81.65% |
| QLD | 0.95% | 0.15% | 137.48% | 18.77% | 63.68% |
| QQQ | 0.18% | 0.43% | 95.69% | 14.16% | 35.12% |
TQQQ | 0.82% | 0.53% | 120.40%
QLD | 0.95% | 0.15% | 137.48%
QQQ | 0.18% | 0.43% | 95.69%
The most visible variable is not the fee. QLD had the higher expense ratio at 0.95% and still outperformed TQQQ over five years. QQQ was the cheapest at 0.18%, yet it delivered the lowest five-year return. That pattern makes a fee-only conclusion too shallow. Volatility, trend persistence, and drawdown depth all feed into the final number.
FAQ
Q1. Why does TQQQ look less powerful than expected over a five-year hold? A1. Between 2021 and 2026, TQQQ delivered a 120.40% five-year total return, but 2022 included a -79.09% drawdown. The daily 3x structure amplifies both upside and downside, so volatility-heavy periods reduce compounding efficiency.
Q2. How severe is an 81.65% five-year maximum drawdown? A2. Compared with QQQ’s 35.12%, it is 2.33x deeper. An 80%-plus drawdown implies a 400%-plus rebound requirement just to get back to break-even, which makes the recovery problem fundamentally different from a normal equity pullback.
Q3. Why did QLD outperform TQQQ? A3. As of 2026-04-21, QLD’s five-year total return was 137.48% with an 18.77% CAGR, while TQQQ posted 120.40% and 16.57%. In the 2021-2026 window, volatility drag mattered more than the extra leverage premium.
Q4. Does a low dividend yield make TQQQ irrelevant? A4. No. TQQQ’s 0.53% yield is secondary. The fund is not designed as an income vehicle; it is designed to amplify the daily movement of the Nasdaq-100. The main variable is trend exposure, not cash flow.
Q5. When do 3x leveraged ETFs become less attractive? A5. They become less attractive in deep selloffs and sharp whipsaw regimes like 2022. They can regain an edge in persistent trend periods like 2023-2026. That is why the key issue is not the fund alone, but whether the market regime fits the fund’s structure.
This is educational research, not personalized investment advice. As of 2026, TQQQ still has strong momentum, but a five-year drawdown of 81.65% and annualized monthly volatility of 61.28% show that the cost of that leverage is high. On a five-year numbers-only read, QLD looks more efficient than TQQQ.
Data links: ProShares TQQQ, ProShares QLD, StockAnalysis TQQQ, StockAnalysis QQQ, YCharts TQQQ drawdown, YCharts QLD drawdown, YCharts QQQ drawdown, FinanceCharts TQQQ total return, FinanceCharts QLD total return, FinanceCharts QQQ total return
This post is for informational purposes only and does not constitute investment advice.