
- As of 2026-04-21, TQQQ’s 5-year total return was 120.40%, with a CAGR of 16.57%.
- As of 2026-03-31, TQQQ’s 5-year maximum drawdown was 81.65%, compared with 35.12% for QQQ.
- 5-year annualized monthly volatility was 61.28% for TQQQ, 20.23% for QQQ, and 40.61% for QLD.
- Over the same 5-year window, QLD outperformed TQQQ with a total return of 137.48% and a CAGR of 18.77%.
- Dividend yield sat at 0.53% for TQQQ, 0.15% for QLD, and 0.43% for QQQ. For leveraged ETFs, the core driver is not cash flow but path dependency.
The Two Charts Say the First Thing
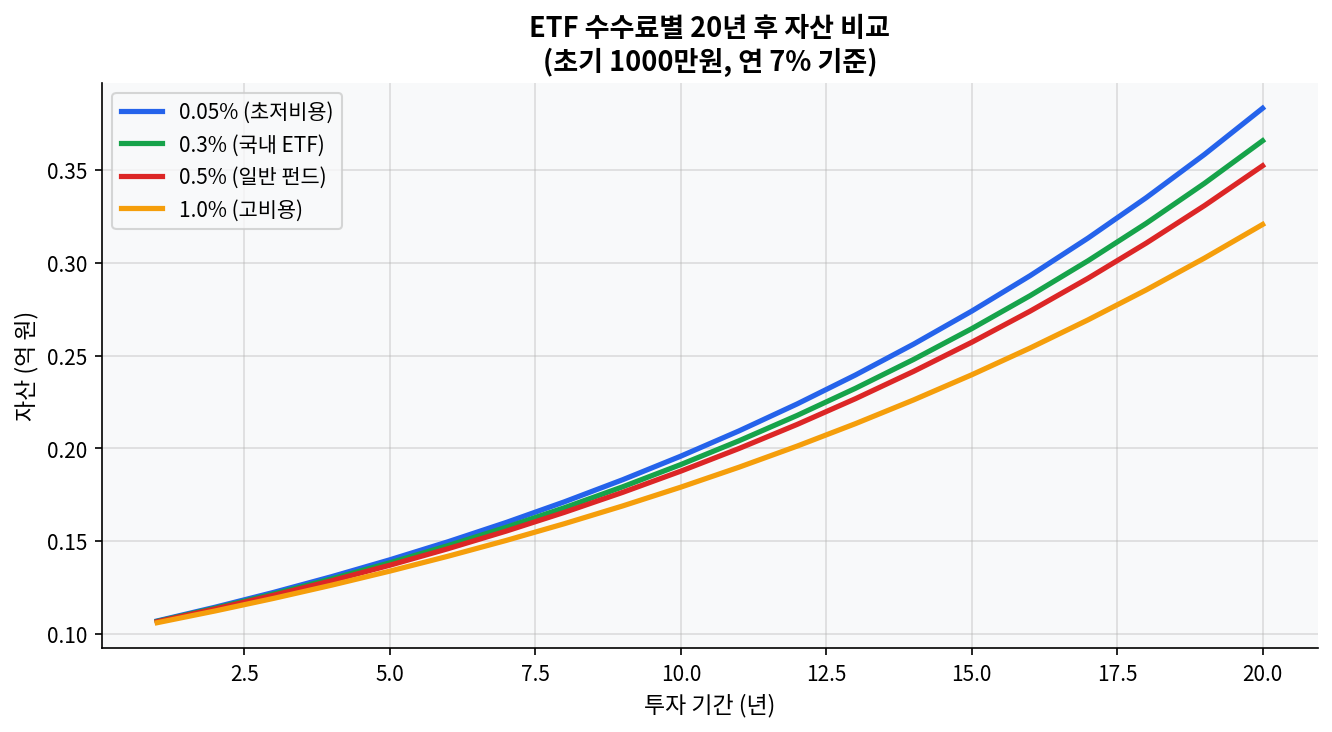
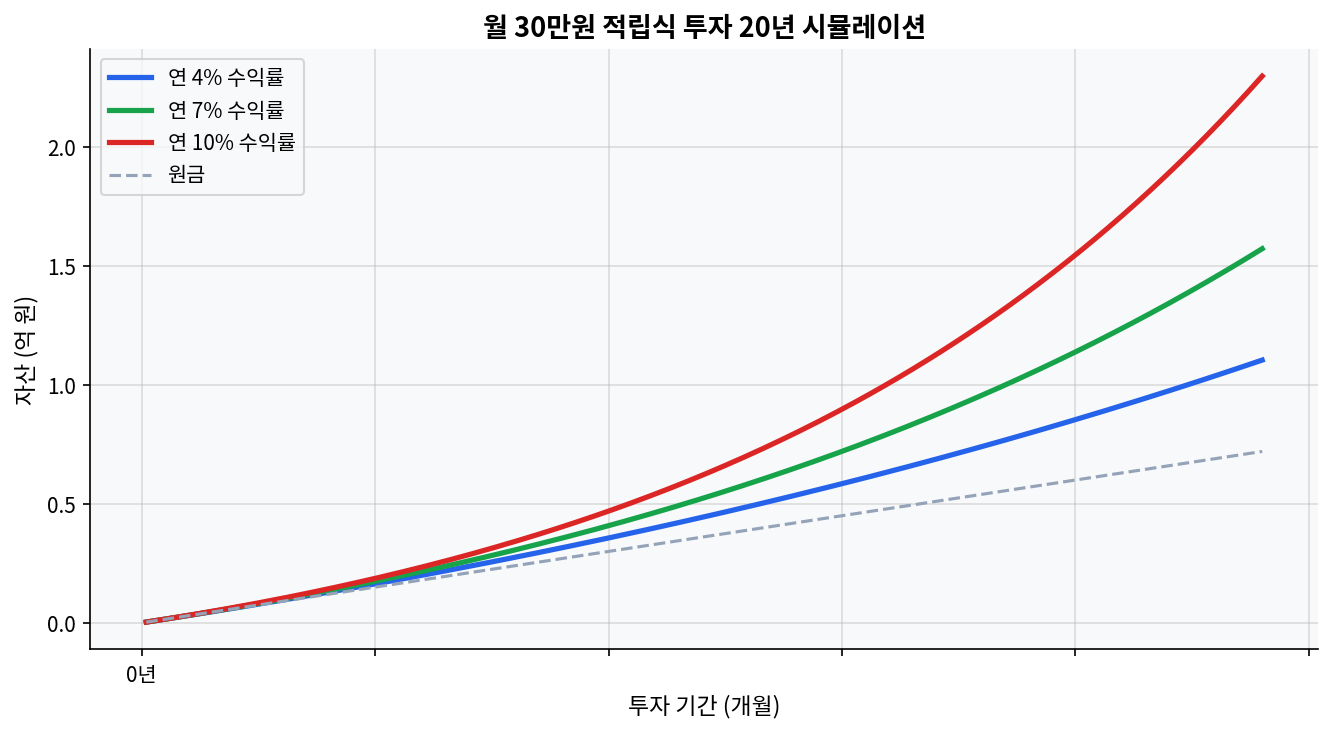
The first chart shows the long-run asset gap between 0.05% and 1.0% ETF fees over 20 years. The second shows how monthly $300 contributions diverge over time at 4%, 7%, and 10% annual returns. In the TQQQ discussion, those two charts are not background noise. For leveraged ETFs, cost and path shape the equity curve faster than the headline return table suggests. Even if TQQQ posts a strong 2020-2026 run, a single 2022-style collapse can damage the long-run profile in ways that are hard to reverse.
As of 2026-04-22, TQQQ traded at $59.58, with a 52-week range of $20.12 to $60.69 and a beta of 3.53. On the surface, that reads like a strong trend near fresh highs. The same numbers also say the entry-point sensitivity remains high. With leveraged ETFs, volatility density matters more than direction alone.
What the Five-Year Numbers Filter Out First
The market narrative is usually simple: a 3x leveraged fund should deliver meaningfully better long-term returns than a 2x fund. The 2021-2026 data pushes back on that idea. Based on FinanceCharts, TQQQ posted a 5-year total return of 120.40% and a CAGR of 16.57% as of 2026-04-21. Over the same period, QLD returned 137.48% with an 18.77% CAGR, while QQQ returned 95.69% with a 14.16% CAGR. The 3x product did not beat the 2x product. That is the key point. The consensus says 3x should be stronger, but the actual five-year path made 2x more efficient.
The annual pattern makes the reason clearer. TQQQ fell -79.09% in 2022, then rebounded +198.04% in 2023, +58.28% in 2024, +34.35% in 2025, and +9.06% year to date in 2026. The data supports a straightforward read: return size is not the only variable. If the drawdown gets deep enough, the starting point for compounding gets reset in a way that takes a very long time to recover. QQQ, by contrast, fell -32.58% in 2022, then gained +54.86% in 2023, +25.58% in 2024, +20.77% in 2025, and +5.02% year to date in 2026. Same Nasdaq-100 family, very different path amplitude.
The nonstandard interpretation here is direct: in this five-year window, TQQQ was not a simple higher-octane version of QQQ, and there was a real stretch where it lagged even QLD on long-term efficiency. The reason is the speed at which volatility drag eats returns once the path becomes choppy. The claim that 3x ETFs are always superior for long holds does not hold up in this sample.
What An 81.65% Drawdown Means
Based on YCharts, TQQQ’s 5-year maximum drawdown was 81.65%. QQQ’s was 35.12%, and QLD’s was 63.68%. On a simple comparison, TQQQ’s drawdown was 2.33 times deeper than QQQ’s and 1.28 times deeper than QLD’s. The more important issue is not the ratio itself, but the time required to recover from that damage. A 50% drawdown requires a 100% gain to get back to breakeven. An 80% drawdown requires a 400% gain. That makes TQQQ’s -81.65% not just a large loss, but a fundamentally different recovery problem.
The 2022 example explains the structure. TQQQ lost -79.09% in 2022, QLD lost -60.52%, and QQQ lost -32.58%. Even inside the same broad Nasdaq growth complex, leverage changes the recovery clock dramatically. The strong rebound in 2023 is what allowed the later five-year statistics to look healthy. Without that rebound, the 2022 loss would likely have remained visible far longer.
From a behavioral standpoint, this matters just as much. A portfolio can survive a temporary 30% decline. An 80% drawdown changes the entire decision process. Dollar-cost averaging may lower the average entry price, but it does not erase the drawdown itself. A common mistake with leveraged ETFs is staring at the upside curve, entering late, and then exiting during a -50% to -80% slide because the actual path feels unbearable. At that point, the long-run result breaks down through behavior, not just math.
Volatility Decomposition: Three Layers of Risk, Not One
1. The leverage layer
As of 2026-03-31, TQQQ’s 5-year annualized monthly volatility was 61.28%. QQQ’s was 20.23%, and QLD’s was 40.61%. In ratio terms, TQQQ ran at roughly 3.03 times QQQ’s volatility and about 1.51 times QLD’s. The daily 3x structure shows up in the longer-horizon volatility series almost exactly as expected. The reason leveraged ETFs are dangerous is simple: expected upside is amplified, but volatility is amplified too.
2. The valuation layer
The fundamental layer is quieter, but it matters. According to ProShares, the Nasdaq-100’s P/E was 31.84 and dividend yield was 0.69% as of 2026-03-31. QQQ’s current P/E was 34.13, with a dividend yield of 0.43%. TQQQ itself is built on swaps and futures exposure, so a traditional P/E does not map cleanly onto the fund. That means TQQQ’s outcome depends more on index valuation compression and expansion, plus daily volatility, than on the earnings of any single company. In a 30x P/E environment, adding 3x daily leverage makes the upside fast, but the correction path harsher.
3. The sentiment layer
In 2026, leveraged ETFs and options-like products remain heavily watched by retail investors. Liquidity is strong. TQQQ’s 30-day median bid-ask spread was 0.02%, which is low. Liquidity, however, is not the same thing as successful ownership. News sentiment can make trading easier, but it does not change the math of leverage. If inflows accelerate, short-term price action can improve. That still does not reduce the damage from a 2022-style decline. Sentiment can lift the product, but the drawdown is still governed by the price path.
There are scenarios where this analysis could miss. If a low-volatility uptrend lasts from 2023 through 2026 and beyond, TQQQ can again outperform the 2x product. That is not theoretical. TQQQ’s 3-year total return was 342.39%, well ahead of QQQ’s 107.12%. In a strong, persistent trend, leverage becomes an advantage again. The disconfirming evidence matters because TQQQ is not a bad asset in absolute terms. It is a demanding asset whose best regime is narrower than most retail narratives imply.
Product Comparison
| Fund | Expense Ratio | Dividend Yield | 5-Year Total Return | 5-Year CAGR | 5-Year Max Drawdown |
|---|---|---|---|---|---|
| TQQQ | 0.82% | 0.53% | 120.40% | 16.57% | 81.65% |
| QLD | 0.95% | 0.15% | 137.48% | 18.77% | 63.68% |
| QQQ | 0.18% | 0.43% | 95.69% | 14.16% | 35.12% |
Quick read in plain format: Fund | Expense Ratio | Dividend Yield | 5-Year Return TQQQ | 0.82% | 0.53% | 120.40% QLD | 0.95% | 0.15% | 137.48% QQQ | 0.18% | 0.43% | 95.69%
The most striking item in the table is not the fee. QLD is more expensive at 0.95%, yet its 5-year return beat TQQQ. QQQ is the cheapest at 0.18%, yet it delivered the lowest 5-year return among the three. That means fees alone do not resolve the question. Volatility, trend persistence, and drawdown depth together decide the final number.
FAQ
Q1. Why does TQQQ often look less powerful than expected over a 5-year hold? A1. Across the 2021-2026 window, TQQQ’s 5-year total return was 120.40%, but a -79.09% drawdown in 2022 sat in the middle of that path. The daily 3x structure amplifies both gains and losses, which lowers compounding efficiency in volatile regimes.
Q2. How serious is an 81.65% maximum drawdown? A2. Compared with QQQ’s 35.12%, it was 2.33 times deeper. An 80% drawdown requires a gain of more than 400% just to recover to breakeven, so this is not just a large fluctuation. It is a different recovery problem.
Q3. Why did QLD outperform TQQQ? A3. As of 2026-04-21, QLD’s 5-year total return was 137.48% and its CAGR was 18.77%, while TQQQ’s were 120.40% and 16.57%. It looks counterintuitive because 3x sounds stronger than 2x, but the 2021-2026 window was a case where volatility drag was stronger than the extra leverage.
Q4. Does TQQQ matter if dividend yield is so low? A4. TQQQ’s 0.53% yield is secondary. The fund is not built for cash flow. It is built to amplify the Nasdaq-100’s daily movement, so trend capture and price elasticity matter more than income.
Q5. When does a 3x leveraged ETF become less attractive? A5. It tends to struggle in high-volatility regimes with sharp selloffs and sharp rebounds, like 2022. In low-volatility trend regimes, like much of 2023-2026, it can regain the edge. The real variable is not just the fund. It is the market regime.
This is educational research, not investment advice. Under U.S. securities rules, suitability depends on individual goals, time horizon, and risk tolerance. As of 2026, TQQQ still has strong momentum, but the 81.65% five-year drawdown and 61.28% annualized monthly volatility show the cost is not cheap. If the five-year lens is the only lens, QLD looks more efficient than TQQQ. The data supports that reading, but shifting one assumption changes the conclusion entirely: in a sustained low-volatility trend, the 3x structure can reclaim the advantage.
Data links: ProShares TQQQ, ProShares QLD, StockAnalysis TQQQ, StockAnalysis QQQ, YCharts TQQQ drawdown, YCharts QLD drawdown, YCharts QQQ drawdown, FinanceCharts TQQQ total return, FinanceCharts QLD total return, FinanceCharts QQQ total return
This post is for informational purposes only and does not constitute investment advice.