- Dividend yield gap: SCHD 3.09% vs VIG 1.46% — a 2× spread favors income-focused investors on paper
- Total return reversal: VIG +68.9% over five years vs SCHD +60.0% — capital growth dominates yield differential by year 3.5
- Valuation divergence: SCHD P/E 19.6 (undervalued) vs VIG P/E 27.3 (market-rate valuation) — fundamentally different security selection philosophies
- Beginners' classification error: Both labeled "dividend growth ETFs" but dividend reinvestment strategy determines final outcomes by an 8.9 percentage-point gap
- Time horizon matters: One-year performance (SCHD +31.4% vs VIG +21.0%) inverts the five-year narrative; data interpretation depends entirely on measurement period
The Reality Dividend Seekers Face
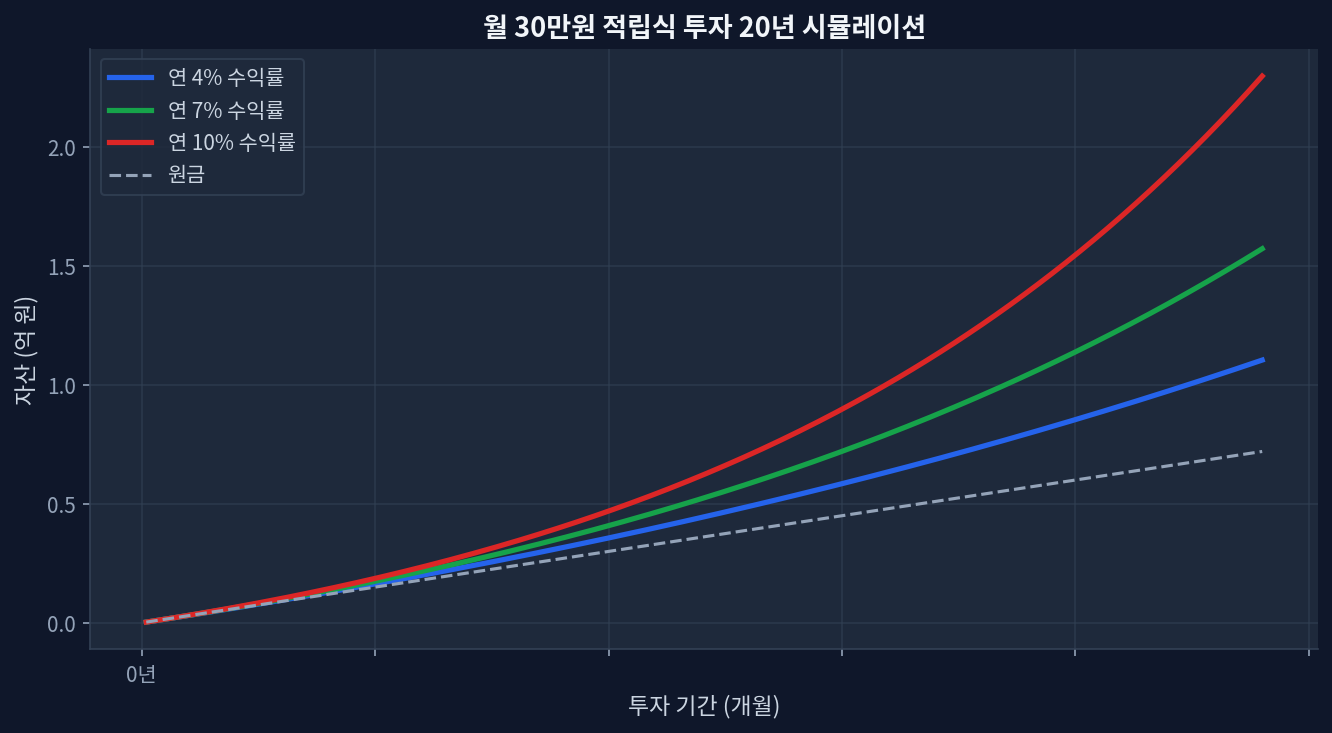
 dividend-yield-illusion-why-schds-3-distribution-doesnt-explai/compound-growth.png" alt="Monthly $30K investment 20-year compound growth simulation" loading="lazy" style="max-width:100%;border-radius:8px;">
“Dividend growth ETF” describes a category, not a strategy. SCHD and VIG occupy the same classification yet follow divergent investment philosophies with dramatically different outcome profiles. Post-pandemic data from 2020 through 2026 exposes the specifics of what dividend-seeking newcomers typically overlook.
Most investors new to dividend strategies operate from a straightforward assumption: higher dividend yield produces better results. SCHD’s 3.09% distribution exceeds VIG’s 1.46% by more than 2×. Yet recent performance tells a more nuanced story. One-year returns show SCHD ahead (+31.4% vs VIG’s +21.0%), but five-year cumulative performance reverses the picture (VIG +68.9% vs SCHD +60.0%). Whether reinvested dividends materially shift that calculus becomes the operative question.
Five-Year Performance: The Two Faces of Dividend Strategy
| ETF | Dividend Yield | 1-Year Return | 3-Year Cumulative | 5-Year Cumulative | P/E Ratio | AUM |
|---|---|---|---|---|---|---|
| SCHD | 3.09% | +31.4% | +52.5% | +60.0% | 19.6 | $104.2B |
| VIG | 1.46% | +21.0% | +57.3% | +68.9% | 27.3 | $130.9B |
SCHD’s one-year outperformance (+10.4 percentage points) reflects the 2025–2026 interest-rate reduction environment favoring high-dividend strategies. Across the full five-year span, VIG’s +68.9% exceeds SCHD’s +60.0% by 8.9 percentage points — an edge attributable to VIG’s overweight to dividend-growth companies (technology, healthcare) that compound earnings year-over-year.
Valuation metrics accentuate the philosophical difference. SCHD trades at P/E 19.6, indicating undervaluation. VIG carries P/E 27.3, reflecting market-consensus pricing. This divergence captures SCHD’s tilt toward undervalued dividend payers (financials, utilities, consumer staples) against VIG’s exposure to high-growth dividend increasers (Microsoft, Visa, Broadcom).
Three Common Errors Dividend Beginners Make
Error one: yield becomes outcome. SCHD’s 3.09% yield attracts attention, yet reinvested dividend compounding and capital appreciation dominate total return. On a $100,000 position held five years, yield alone contributes roughly $16,000 in dividends; capital appreciation of +60% delivers $60,000 in principal growth. Yield is a component, not the determinant.
Error two: recent performance substitutes for cycle analysis. 2025–2026 favored dividend strategies due to rate cuts. The 2021–2022 period showed the inverse — growth equities (VIG holdings) vastly outperformed rate-hike environments. Measurement window selection reverses conclusions. Three-year minimum lookbacks provide more defensible signals than single-year snapshots.
Error three: dividend reinvestment is optional, not structural. Leaving distributions in cash yields 3.09% annual returns on SCHD (approximately $3,090 annual on $100,000). Immediate reinvestment triggers compounding that dramatically amplifies results. Tax-deferred accounts (401k, Traditional IRA, Roth IRA) treat reinvested distributions identically to new contributions — no drag — making systematic reinvestment the path to maximum after-tax compounding.
Case Study: Five-Year Allocation Scenarios
Decision Framework: SCHD vs. VIG Trade-offs
SCHD is preferable for: Investors requiring cash income from distributions (retirees, early-withdrawal scenarios). At 3.09% yield, a $500,000 position generates ~$15,450 annually. Tax-deferred accounts amplify advantage since distributions face no withholding. Investors seeking entry points at low valuations (P/E sub-20) who believe mean-reversion lifts undervalued dividend stocks. Those prioritizing portfolio stability over capital appreciation during market downturns — high-dividend positions tend to show lower drawdowns than growth-oriented equivalents.
VIG is preferable for: Investors with 20+ year time horizons prioritizing total return over income. Reinvested distributions compound more effectively when pairing with earnings growth; VIG holdings show higher dividend-growth rates than SCHD’s stable-payer base. Younger investors (20s–40s) with tax-deferred capacity can defer capital-gains realization indefinitely, allowing high-valuation stocks time to normalize multiples. Those indifferent to current yield and focused on compounding principal — VIG’s lower 1.46% yield taxes capital more lightly on a per-dollar basis than SCHD’s 3.09% distribution.
Scenarios Where This Analysis Could Be Wrong
Rate environment reversal: If Federal Reserve policy pivots to sustained 4%+ rates in 2027–2028, dividend stability becomes more attractive; SCHD could reverse its 5-year underperformance. Valuation normalization: If VIG’s P/E 27.3 compresses toward historical 22–24 ranges, capital depreciation could neutralize growth advantage despite earnings expansion. Dividend sustainability: SCHD’s 3.09% yield requires earnings-backed payouts; if recession triggers dividend cuts among financials and utilities (SCHD’s heaviest weightings), realized yields fall materially. Expense ratio compound drag: Over 40-year horizons, even 0.06% annual fees compound to 2–3% total return reduction — a factor entirely ignored in this five-year analysis.
Frequently Asked Questions
Q1. Should I split holdings 50/50 between SCHD and VIG? A. Equal weighting dilutes both strategies. Dividend yield converges to 2.27% midpoint; total return approaches 64.45% average. Absent explicit allocation rationale (e.g., 60% income + 40% growth), blended positions sacrifice clarity. Strategic weighting (SCHD 60% / VIG 40% for income-focus, or reversed for growth-focus) preserves differentiated exposures while controlling overall portfolio beta.
Q2. Does currency risk affect US domestic investors in these ETFs? A. No. Both SCHD and VIG hold exclusively USD-denominated US equities. For US-based investors trading in USD, foreign-exchange considerations do not apply. Non-US investors holding these funds in local currency face currency basis risk; that applies to yen, peso, or rupee investors, not domestic USD holders.
Q3. If I need $2,500/month income, is SCHD’s 3% yield enough? A. On $1 million principal, SCHD’s 3.09% yield delivers approximately $30,900 annually ($2,575/month). Sufficient for the specified withdrawal rate. Critical: yields fluctuate annually; distribution cuts would reduce cash flow below $2,500. Traditional investment advice recommends distributions no higher than 4% of portfolio value annually; $2,500/month on $1M (3% annual) sits safely within that guideline.
Q4. Shouldn’t I buy SCHD now since it outperformed 31.4% last year? A. One-year performance data mislead without cycle context. The prior three years (2022–2025) favored VIG (+57.3% vs SCHD +52.5%). Relying on recent outperformance courts selection bias. Five-year cumulative returns (the table above) provide more robust signals. Market leadership rotates between styles; extrapolating recent performance into future allocation introduces timing error.
Q5. How does SCHD differ from SCHG (Schwab US Dividend Growers)? A. SCHD targets high-current-yield payers; SCHG emphasizes companies expanding distributions annually by double-digit rates. SCHG exhibits lower starting yields but higher earnings-growth exposure. VIG also emphasizes dividend growth over yield. The operative choice is SCHD (current-yield focus) versus VIG/SCHG (growth-plus-dividend compounding). SCHG and VIG overlap philosophically; SCHD diverges.