- SCHD currently yields 3.21% trading at a 19.5 P/E, presenting a distinct valuation discount against VIG's 1.48% yield and 26.2 P/E.
- Trailing 5-year data shows VIG (+66.4%) outpacing SCHD (+53.7%), highlighting the persistent growth versus yield tradeoff in modern asset allocation.
- Short-term momentum favors SCHD, which posted a +31.3% 1-year return, driving the asset to 99.1% of its 52-week range ($32.83).
- Relying solely on historical dividend growth can lead to an incomplete risk assessment, requiring explicit modeling of market drawdowns and shifting rate environments.
Redefining Yield and Growth in the Accumulation Phase

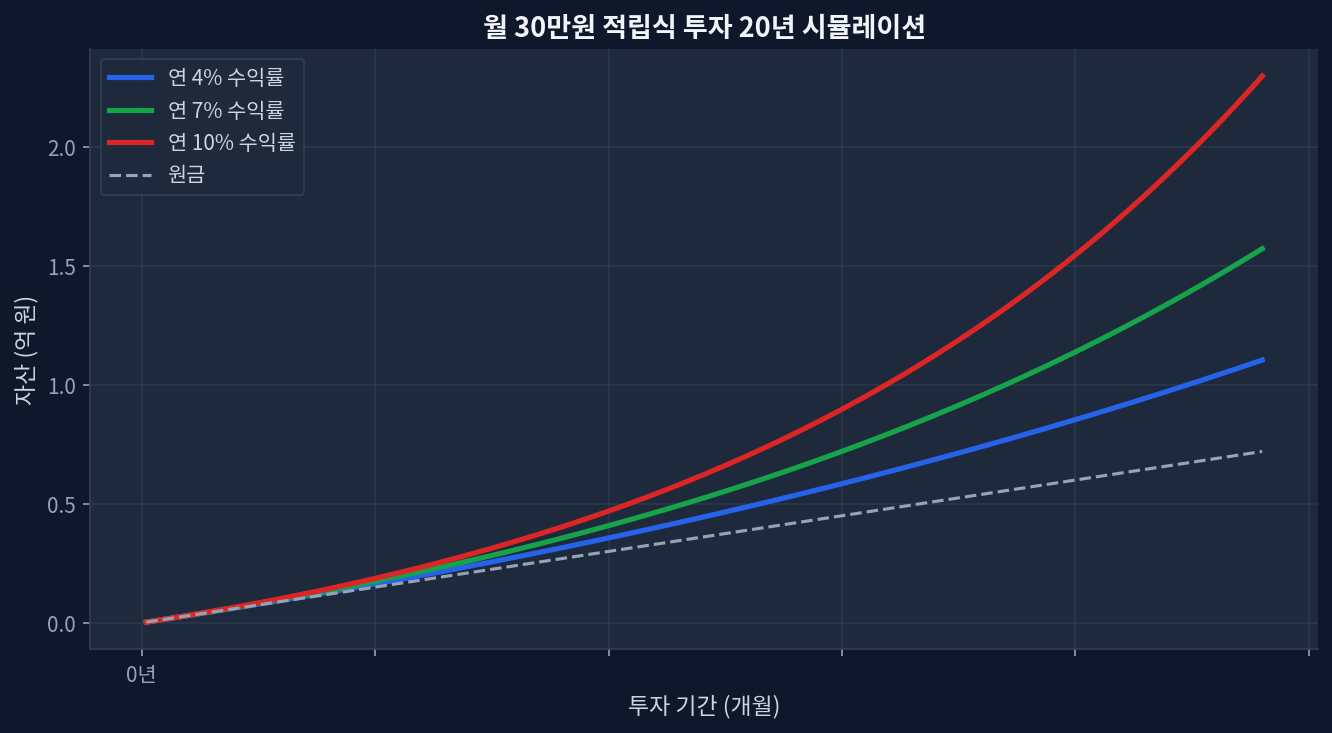
Observing the chart below, which illustrates a 20-year monthly accumulation simulation, the trajectory of compound growth at varying rates highlights the mathematical reality of long-term investing. For demographic cohorts entering their 50s—similar to the target audience of late-stage planning frameworks—the capital accumulation runway compresses significantly. This structural reality shifts the analytical priority away from maximizing top-line beta exposure toward sequence-of-returns protection and generating reliable cash flow.
The allocation of $1,000 monthly requires precise targeting. Shifting capital into value-oriented dividend equities alters the portfolio’s underlying factor exposure, trading potential tech-driven upside for current yield and lower volatility. The focus shifts entirely to calculating the optimal intersection of dividend yield and fundamental valuation.
Comparative Valuation: SCHD Against VIG
Evaluating the dividend factor necessitates a peer comparison to contextualize the metrics. SCHD manages $91.1B in AUM and currently trades at $32.83, precisely 99.1% of its 52-week range of $25.89 to $32.89. The strategy delivers a 3.21% dividend yield attached to a relatively conservative P/E ratio of 19.5. [Yahoo Finance]
Conversely, VIG represents the dividend growth archetype with a larger footprint of $124.6B AUM. Currently priced at $233.1—sitting at 98.9% of its $195.62 to $233.5 range—VIG yields a much lower 1.48%. The market applies a growth premium here, assigning VIG a P/E of 26.2. [Morningstar]
Historical momentum diverges based on the timeframe analyzed. Over a 5-year horizon, VIG’s heavy allocation to structural growth drivers generated a +66.4% cumulative return, suppressing SCHD’s +53.7%. Yet, analyzing the trailing 1-year data reveals SCHD delivering +31.3% compared to VIG’s +21.5%, driven largely by a sharp mean reversion in cyclical value sectors.
| Product Name | Fee (Expense Ratio) | Yield | P/E Ratio | AUM (Market Cap) |
|---|---|---|---|---|
| SCHD | 0.06% | 3.21% | 19.5 | $91.1B |
| VIG | 0.06% | 1.48% | 26.2 | $124.6B |
Assessing Disconfirming Evidence and Structural Risks
A rigorous analytical framework demands examining conditions where the primary thesis fails. The prevailing consensus views dividend growth ETFs as a defensive bedrock. However, this diverges from the market narrative on duration risk. When interest rates rise aggressively, the equity risk premium compresses, leaving dividend equities highly vulnerable to valuation multiples contracting.
Many retail models incorporate a scenario_missing_downside flaw; they linearly project 3.21% yields and steady capital appreciation without stress-testing a severe 30% drawdown occurring simultaneously with the start of retirement distributions. If value factors experience a multi-year period of underperformance—similar to the technology-dominated run of the late 2010s—an overly concentrated position in SCHD will severely drag the entire portfolio’s performance metrics. [ETF[.com]](https://www.etf.com)
Frequently Asked Questions
Is SCHD appropriate as a core portfolio holding for investors in their 50s? The 19.5 P/E and 3.21% yield offer a strong foundation for cash-flow generation, but its heavy value factor exposure necessitates pairing it with broad-market or growth allocations to prevent sector concentration risk.
Why does VIG exhibit higher 5-year returns despite a much lower yield? VIG holds a higher allocation to technology and growth sectors that reinvest capital internally rather than paying it out. This generated higher capital appreciation (+66.4%) over the last five years compared to SCHD (+53.7%).
Does SCHD trading near its 52-week high (99.1%) present a specific entry risk? Trading at $32.83, just shy of the $32.89 peak, indicates strong recent momentum (+31.3% 1-year). While short-term pullbacks are statistically probable, long-term systematic accumulation mitigates localized entry pricing risk.
What happens to dividend ETFs during a macroeconomic recession? While dividends from high-quality companies typically remain more resilient than corporate earnings, the underlying NAV will still suffer significant drawdowns during broad market liquidations.
Can equity dividend yields replace fixed-income bond ladders entirely? Equities and fixed-income serve structurally different purposes. While SCHD provides a 3.21% yield that outpaces many inflation metrics, it carries equity-level volatility, making it an unsuitable direct proxy for the capital preservation function of Treasury bonds.
📊 Verify this data yourself
import yfinance as yf
t = yf.Ticker("SCHD")
t.history(period="5y")["Close"].pct_change().add(1).cumprod()