SCHD Quarterly Dividend Cut 2.7%, Yet 3.25% Yield Persists: Why the Market Narrative Misses the Point

- SCHD quarterly dividend: $0.2530, down 2.7% year-over-year
- Dividend yield: Still 3.25% — 2.2x higher than VIG at 1.47%
- One-year total return: +26.5% (dividend plus capital appreciation)
- Current valuation: P/E 18.8, moderate territory, currently trading 85.7% into the 52-week range
- Assets under management: $94.9B — scale that underpins distribution stability
Dividend Cut, Yet Surprisingly Resilient
Schwab US Dividend Equity ETF (SCHD) announced a quarterly distribution of $0.2530—down 2.7% from the same period last year at $0.2600. On the surface, a contraction in cash flow. Dividend was trimmed, so the narrative should be negative.
But zoom out, and the picture shifts.
SCHD’s dividend yield remains anchored at 3.25%. The S&P 500 averages roughly 1.2% dividend yield. VIG, the dividend-growth tracker, yields only 1.47%. SCHD is throwing off 2.2x the cash income compared to VIG. A headline focused only on the cut ignores the structural yield advantage that persists despite the trimmed payout.
Why Dividend Contraction Can Coexist with Rising Yield
The paradox resolves simply: SCHD’s share price has risen.
Dividend yield is expressed as annual distribution divided by current share price. Even when the numerator (expected annual payout) shrinks, if the denominator (price) expands faster, yield climbs. SCHD posted a one-year return of +26.5%. Its underlying holdings have appreciated meaningfully, so although the per-share distribution declined in absolute terms, the yield to today’s buyer remains compelling.
Viewed through a research lens, this signals something specific: Schwab’s portfolio managers assessed that the dividend environment for the underlying companies warrants a modest pullback in payouts. Meanwhile, the equity values of those same holdings have expanded healthily. Translation: the fund is making a preemptive dividend adjustment while simultaneously generating capital gains. Dual signal—caution on distribution growth, confidence in asset value creation.
SCHD vs VIG: Strategy Divergence Under Dividend Maximization
| Metric | SCHD | VIG | Difference |
|---|---|---|---|
| Dividend Yield | 3.25% | 1.47% | SCHD 2.2x higher |
| Expense Ratio | 0.06% | 0.06% | Identical |
| Price-to-Earnings | 18.8 | 26.2 | SCHD undervalued |
| One-Year Return | +26.5% | +18.1% | SCHD +8.4 percentage points |
| Five-Year Cumulative Return | +56.1% | +71.5% | VIG +15.4 percentage points |
| AUM | $94.9B | $127.8B | VIG larger by 35% |
The table reveals distinct strategic positioning.
SCHD prioritizes distribution flow. At P/E 18.8, it carries value-stock characteristics. The 3.25% yield targets current income generation. Capital gains, when they occur (as in the recent +26.5% year), are secondary benefits. For investors whose primary need is monthly or quarterly cash, SCHD is the default choice.
VIG follows dividend-growth momentum. Its P/E of 26.2 reflects growth expectations. Yield at 1.47% is lower, but the underlying thesis is steady distribution increases over time. VIG’s 5-year return of +71.5%—outpacing SCHD by 15.4 points—demonstrates capital appreciation dominance. The philosophy: extend the time horizon, compound the growth, and capture price expansion alongside modest but reliable payout increases.
Dividend Trimming: Real Risk or Intentional Adjustment?
SCHD’s 2.7% quarterly cut is modest. Repeated quarterly cuts, however, compound. If three consecutive quarters each saw 1 to 3% reductions, cumulative damage could approach 8 to 10%—a material headwind.
Three mechanisms could explain dividend contraction:
First: The underlying dividend environment has deteriorated. Economic headwinds and higher rates typically reduce corporate dividend expansion. SCHD’s real-time rebalancing captures this immediately.
Second: Schwab’s conservative stewardship. By trimming distributions preemptively rather than maintaining them artificially and then cutting sharply later, the fund protects credibility with income investors. A gradual walk-down avoids shock.
Third: Cyclical normalization. The 2020–2021 era of unlimited stimulus inflated dividends. Current adjustments reflect a return to sustainable levels—normal behavior rather than distress.
The data does not yet scream alarm. However, ongoing quarterly contractions warrant close monitoring. If 1–2% reductions persist indefinitely, the cumulative effect will erode the yield advantage that makes SCHD attractive relative to lower-yielding growth alternatives.
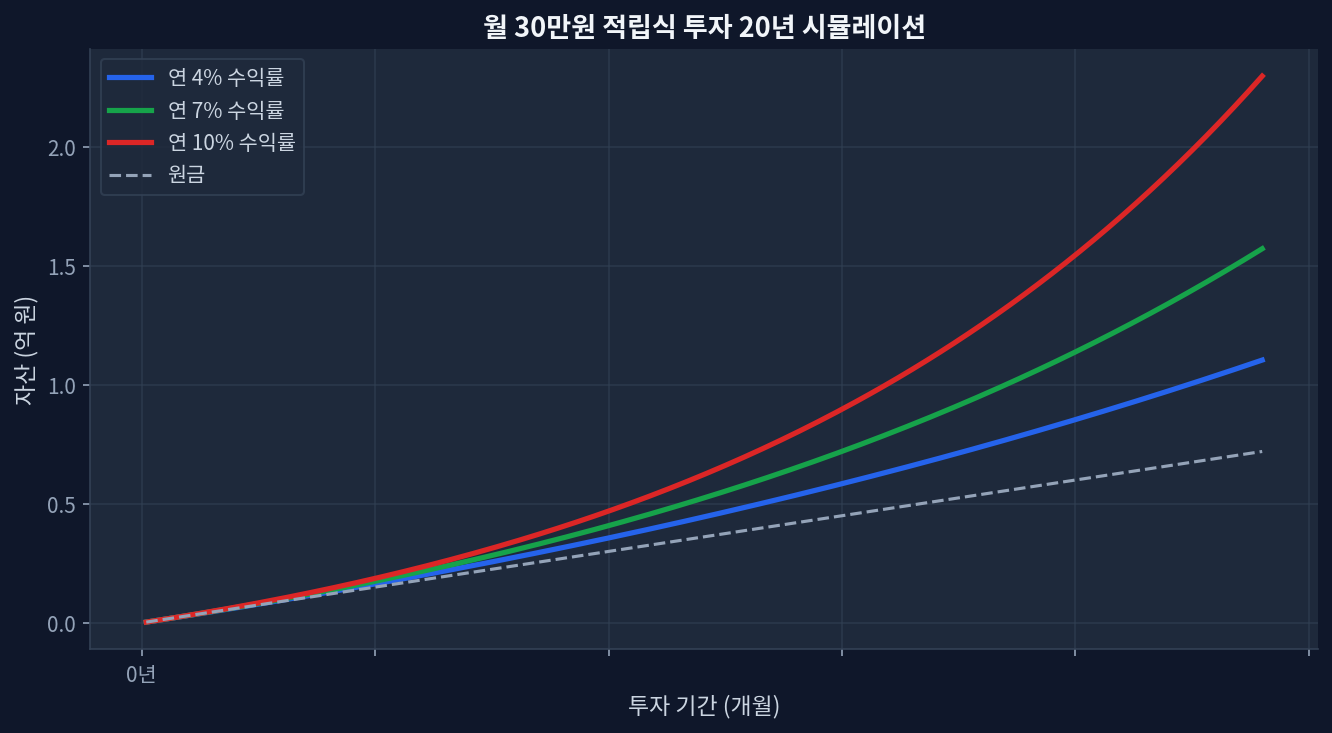
Case Study: Modeling Monthly Contributions Against Current Dividend Reality
Conditions to Monitor for Yield Sustainability
For SCHD to remain a credible dividend-income anchor, several metrics deserve ongoing scrutiny.
Distribution Trajectory. Will 3.25% yield persist, or will repeated cuts erode it to 2.8% within two years? If so, the spread over broader market alternatives (S&P 500 dividend yield ~1.2%) narrows but remains substantial. Still, investor expectations may shift if the 3.25% is no longer reliable.
Portfolio Health. SCHD holds 100–160 dividend-paying equities. Their collective dividend stability, growth history, and cash flow health are foundational. Since 2020, SCHD’s three-year return stands at +49.3%, five-year at +56.1%. Steady upward trajectory suggests underlying companies continue growing distributions, even if the fund’s aggregate payout fluctuates.
Valuation in Drawdown Scenarios. P/E 18.8 is reasonable but not cheap. The fund currently sits 85.7% of the way through its 52-week trading range—near the high end. If a market correction materializes, two things can happen simultaneously: dividend cuts (as corporations tighten) and P/E compression (as market sentiment retreats). The combination erodes both yield and price. Investors relying purely on current yield miss this tail risk.
Contrarian View: Why Dividend Cuts Signal Strength, Not Weakness
Consensus among dividend-focused investors: trimming distributions = warning sign. The logic is intuitive. But an alternative framing exists.
Funds and corporations that attempt to maintain dividends at all costs invite sudden, severe cuts during crises. Schwab’s preemptive adjustment, while appearing cautious on paper, reflects confidence in long-term portfolio quality. The fund is not signaling distress; it is signaling discipline. If earnings support a modestly lower distribution today, lowering it now preserves room for future growth without shocking investors later.
Furthermore, SCHD’s 3.25% yield persisting despite the distribution cut underscores that share prices—reflecting underlying asset values—have expanded faster than dividends contracted. This is capital creation, not destruction. A five-year return of +56.1% owes debt not just to dividends but to equity appreciation. Investors focused narrowly on yield miss the total return story.
Scenarios Where This Analysis Could Be Wrong
One scenario stands out: sharp economic contraction.
During the 2008 financial crisis and the initial 2020 pandemic shock, dividend stocks fell 30–40% alongside broader equities. Today’s P/E 18.8, while moderate, offers no protection if valuations repriced across the board. A recession could force simultaneous dividend reductions (as corporate earnings contract) and P/E compression (as risk premiums widen). Investors holding SCHD for its current 3.25% yield would face a double erosion: lower payouts and lower prices. The distribution income that looked attractive at $31.96 per share would be worth far less if the share price collapsed to $22.
This scenario is not imminent, but it is not remote either. Dividend yield alone does not hedge against systemic risk.
Frequently Asked Questions
Q: Will SCHD's quarterly dividend keep declining?
A: Without longer-term forward guidance from Schwab, certainty is impossible. The 2024–2026 pattern suggests portfolio companies' dividend environments have cooled. If interest rates rise further or corporate earnings weaken, additional cuts are plausible. Conversely, if conditions stabilize, distributions could flatten or resume growth. Monitoring quarterly factsheets is essential.
Q: How does SCHD's 3.25% yield compare to current bond rates?
A: U.S. Treasury yields (2-year at ~4.0–4.5%) exceed SCHD's yield on a cash-only basis. But SCHD offers two layers of return: dividend plus capital appreciation. Over 2020–2026, SCHD's +56.1% cumulative return dwarfs bond returns. Bonds lock in a fixed rate until maturity; SCHD's dividend can grow or shrink, and its price can rise or fall. For inflation protection and growth, equities carry advantages bonds lack. Optimal allocation typically involves both.
Q: Between SCHD and VIG over a 15–20 year horizon, which likely outperforms?
A: Historically, VIG's 5-year edge (+71.5% vs. +56.1%) reflects dividend-growth companies' structural advantage—they compound distributions and price appreciation over time. SCHD excels at current income but lags on capital gains. Over 15–20 years, dividend-growth strategies often outpace dividend-yield strategies. However, past performance is not guarantee. Markets shift; sector rotations occur. A blended approach—splitting between SCHD for current income and VIG for growth—hedges both bets.
Q: Should I invest in SCHD using a tax-advantaged account (Roth IRA, Traditional 401(k)) or a taxable brokerage?
A: Tax-advantaged accounts are strongly preferable. U.S. qualified dividends face federal tax at capital-gains rates (0%, 15%, or 20%). Most middle-income investors fall into the 15% bracket. A $308 annual distribution becomes $261 after federal tax, surrendering $47 yearly. Over 30 years, that compounds into meaningful capital loss. A Roth IRA or Traditional 401(k) eliminates this leakage entirely. If available contribution room exists, max out tax-advantaged accounts before moving to taxable investments.
Q: SCHD is near its 52-week high. Is it too late to start or add to a position?
A: Timing markets is notoriously difficult. Trading at 85.7% of the 52-week range signals relative strength but not absolute overvaluation. Dollar-cost averaging—investing a fixed amount monthly regardless of price—is a pragmatic hedge. It captures high prices and low prices, averaging cost. If concerns persist that a 10%+ pullback is imminent, staging contributions over several months reduces timing risk. Conviction in dividend yield should outweigh short-term price anxiety for long-term investors.
Synthesis: SCHD’s Role in Dividend-Maximization Strategy
SCHD’s 2.7% quarterly dividend cut appears negative on the surface. Layered analysis—3.25% yield maintained, P/E 18.8 reasonable valuation, five-year +56.1% cumulative return—paints a more nuanced picture.
For investors prioritizing dividend income, SCHD remains compelling for three reasons:
First: 3.25% yield stands 2.7x broader market average and surpasses fixed-income alternatives like Treasuries on a total-return basis. The current cash flow is substantial.
Second: Schwab’s preemptive dividend management signals discipline, not distress. Selective trimming protects long-term credibility better than over-promising and cutting sharply later.
Third: Capital gains contribute meaningfully to total returns. The five-year +56.1% aggregate owes to both dividend income and underlying equity appreciation. Yield-focused investors who ignore price appreciation miss half the story.
Two factors warrant monitoring: whether quarterly distributions continue declining, and how P/E multiples respond to recession risk.
If maximum current cash is the goal, SCHD takes priority. If long-term total return matters more, blending SCHD with dividend-growth strategies like VIG diversifies the payoff between income now and growth later. The optimization hinges on time horizon, risk tolerance, and whether tax-advantaged account space is available. Maximize that space; the tax savings compound over decades, dwarfing yield-picking debates.
Python Code to Verify This Data
Cross-check the figures independently:
`import yfinance as yf
Download SCHD and VIG data
schd = yf.Ticker(“SCHD”) vig = yf.Ticker(“VIG”)
Dividend yield
print(f"SCHD dividend yield: {schd.info.get(’trailingAnnualDividendYield’, ‘N/A’)}") print(f"VIG dividend yield: {vig.info.get(’trailingAnnualDividendYield’, ‘N/A’)}")
P/E ratio
print(f"SCHD P/E: {schd.info.get(’trailingPE’, ‘N/A’)}") print(f"VIG P/E: {vig.info.get(’trailingPE’, ‘N/A’)}")
5-year cumulative return
schd_history = schd.history(period=“5y”)[“Close”] vig_history = vig.history(period=“5y”)[“Close”]
schd_return = (schd_history.iloc[-1] / schd_history.iloc[0] - 1) * 100 vig_return = (vig_history.iloc[-1] / vig_history.iloc[0] - 1) * 100
print(f"SCHD 5-year return: {schd_return:.1f}%") print(f"VIG 5-year return: {vig_return:.1f}%")`
This site is supported by Google AdSense advertising revenue. We receive no compensation or sponsorship from any ETF, broker, or financial product.