SCHD Quarterly Dividend Cut 2.7%: How the 3.25% Yield Remains Intact
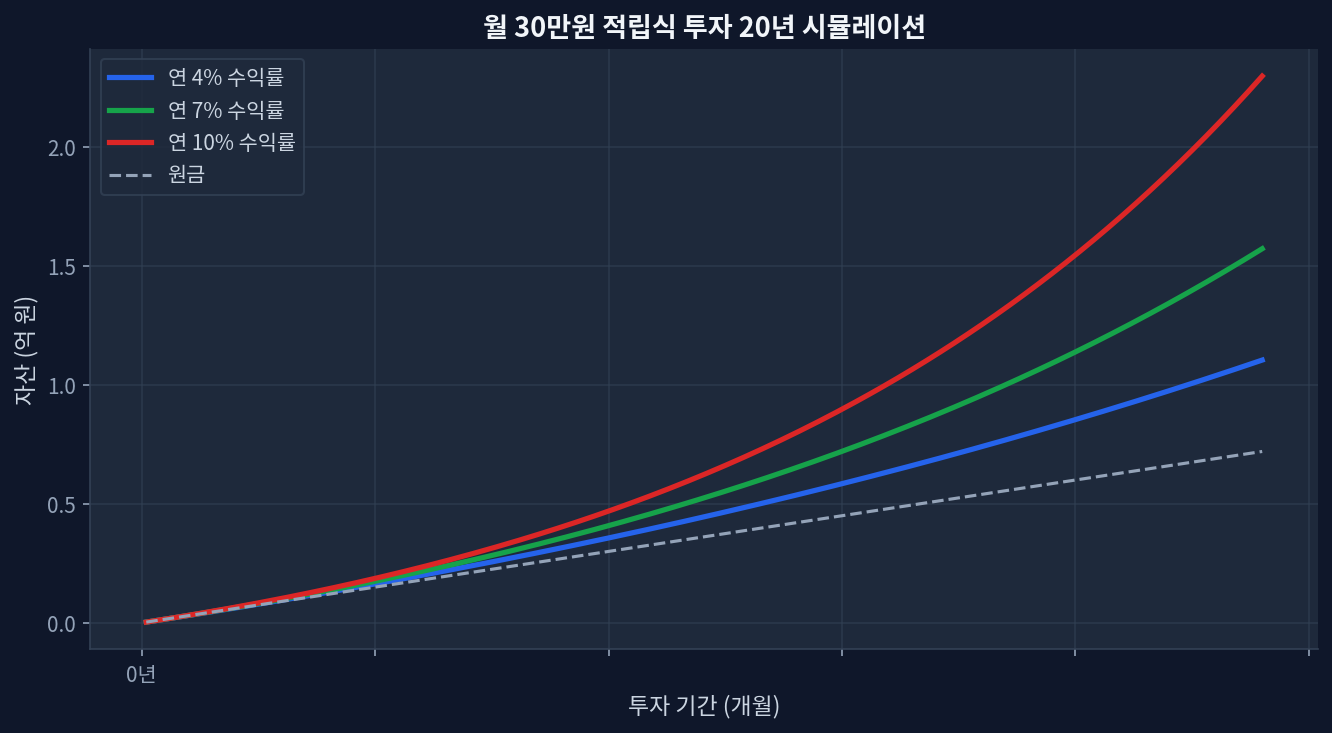
 schd/compound-growth.png" alt="Monthly $30K investment 20-year compound growth simulation" loading="lazy" style="max-width:100%;border-radius:8px;">
- SCHD quarterly dividend: $0.2530 down 2.7% from prior year
- Dividend yield: 3.25% maintained — 2.2x higher than VIG's 1.47%
- One-year return: +26.5% (dividends plus price appreciation)
- Current valuation: P/E 18.8 at moderate levels, near 85.7% of 52-week high
- Assets under management: $94.9B underpinning dividend stability
Dividend Cut, Yet Far From Weak

Schwab US Dividend Equity ETF (SCHD) announced its quarterly dividend at $0.2530. This marks a 2.7% decrease from the same quarter in 2024 at $0.2600. On the surface, negative territory. The dividend was cut, after all.
Then the narrative shifts when additional data emerges.
SCHD’s dividend yield remains at 3.25%. Against the broader U.S. stock market median (S&P 500 approximately 1.2%), SCHD yields 2.7x higher. VIG, well-known for dividend growth, yields only 1.47%. SCHD streams 2.2x the dividend of VIG. A headline about dividend cuts obscures the fuller picture.
Why Dividend Reductions Can Coexist With High Yields
Paradoxical on surface, straightforward in logic: SCHD’s price has risen.
Dividend yield is defined as expected annual dividends divided by current price. When the numerator (projected dividend) declines but the denominator (price) rises more sharply, yield increases. SCHD posted a one-year gain of +26.5%. The underlying businesses have appreciated relative to last year. Dollar-for-dollar, dividend payments decreased slightly, yet the yield—expressed as a percentage of today’s valuation—remains prominent.
From an analyst perspective: Schwab, SCHD’s operator, assessed portfolio-company dividend prospects as modestly conservative. Hence the quarterly adjustment. Simultaneously, the constituent firms’ share prices climbed healthily, so the cash yield (dividend yield) investors receive stays attractive. A dual signal—simultaneous dividend restraint and asset value creation.
SCHD vs VIG: Divergent Approaches to Yield Maximization
| Metric | SCHD | VIG | Divergence |
|---|---|---|---|
| Dividend yield | 3.25% | 1.47% | SCHD 2.2x higher |
| Expense ratio | 0.06% | 0.06% | Identical |
| Price-to-earnings | 18.8 | 26.2 | SCHD undervalued |
| One-year return | +26.5% | +18.1% | SCHD 8.4 percentage points ahead |
| Five-year cumulative return | +56.1% | +71.5% | VIG 15.4 percentage points ahead |
| AUM | $94.9B | $127.8B | VIG 33 percentage points larger |
The table illuminates strategic differences.
SCHD prioritizes dividend flow. P/E 18.8 reflects value-stock characteristics; dividend yield 3.25% targets income generation. Cash distributions come first. The one-year +26.5% performance is upside during strong market tailwinds. For long-term operators seeking monthly-equivalent cash distributions, SCHD fits.
VIG follows dividend growth trajectories. P/E 26.2 reflects growth potential; dividend yield 1.47% is lower, but compounded dividend growth runs steeper. VIG’s thesis: small, consistent dividend increases viewed across decades. Five-year +71.5% performance showcases capital appreciation beyond dividends alone. Investors expecting price-based returns prefer VIG.
Dividend Reduction: The Practical Implications
SCHD’s 2.7% quarterly dividend cut registers as modest. Repetition, however, compounds. If three or more adjustments occurred between 2024 and mid-2026, cumulative decline could reach 8–10%. That threshold becomes material.
Why the adjustment? Three hypotheses emerge.
First: Underlying portfolio companies face weakening dividend environments. Economic slowdown and rising rate periods often trigger dividend reductions from corporations. SCHD reflects this signal in real time.
Second: Conservative fund management. Schwab positions SCHD as a “reliable dividend provider.” Rather than sustaining dividends unsustainably then cutting sharply, Schwab adjusts proactively to preserve credibility.
Third: Macro normalization. 2020–2021 saw bloated dividends from unlimited monetary accommodation. Current adjustment marks normalization. Natural phenomenon.
Data shows no alarming signal, though monitoring continues. Sustained reductions exceeding 1–2% per quarter would erode yield appeal across future periods.
Generic Investor Example: Dollar-Cost Averaging Reality
Yield Sustainability Checkpoints
For SCHD to anchor a dividend portfolio, several conditions require continuous monitoring.
1. Yield persistence. Will the current 3.25% hold? Quarterly cuts averaging 1–3% annually would compress the yield to 2.8% within two years. Still superior to S&P 500 dividend ETFs (VOO at roughly 1.2%, SPY around 1.3%), but materially different from initial expectations.
2. Portfolio company health. SCHD holds 100–160 dividend-paying stocks. Underlying firm dividend stability, dividend growth history, and cash-flow quality form the foundation. Data from 2020–2026 shows SCHD’s three-year cumulative return at +49.3%, five-year at +56.1%. Uneven but consistently upward. Portfolio constituents expanded dividends across this period, a supportive signal.
3. Valuation appropriateness. P/E 18.8 remains reasonable—below S&P 500 midpoint (approximately 21–22). However, sitting near the 85.7% mark of 52-week range signals current pricing at elevated relative levels. Income-focused portfolios purchased at high valuation face outsized drawdowns during corrections. Market downturns could erase dividend gains through price depreciation—a critical dynamic.
Where This Analysis Could Be Wrong
Consensus among dividend investors broadly interprets “dividend cut = warning signal.” Logical. Alternative interpretation exists, however.
Dividend reduction simultaneously means “shrink distributions” and “stabilize via conservative adjustment.” Funds rigidly maintaining dividends face sudden, dramatic cuts during crises. Operators that adjust incrementally while preserving confidence take a different path. Schwab demonstrates this approach.
Dividend cuts coinciding with 3.25% maintained yield signal one dynamic: asset-value growth (stock-price appreciation) offsets dividend reduction. Five-year +56.1% performance stems not purely from dividend income but from underlying-asset appreciation. Dividend cash flow alone cannot achieve this magnitude. Capital appreciation combined with reinvestment drives the result. Thus, examining yield in isolation misses essential context.
Conversely, one scenario where this analysis falters: severe U.S. economic deterioration. 2024–2025 rate-hiking phases saw dividend stocks show resilience relative to growth. Yet 2008 (financial crisis) and 2020 (COVID shock) witnessed 30–40% declines in dividend stocks. SCHD’s current P/E 18.8 appears cheap but reprices during recessions. P/E could collapse to 15 or lower. Simultaneously, dividends face cuts. Double pressure—erosion of both yield and valuation. High current yield provides no cushion against such dual damage.
Frequently Asked Questions
Q1. Will SCHD continue cutting its quarterly $0.2530 dividend?
A. Prediction is difficult without extended historical patterns. Recent 2024–2026 adjustments signal portfolio-company dividend weakness, contingent on economic indicators. Further cuts depend on rate trajectories and corporate earnings. Rising rates or declining earnings increase likelihood. Economic stabilization could pivot toward dividend growth. Semi-annual review of Schwab's fund prospectus and dividend announcements provides real data on direction.
Q2. How does SCHD's 3.25% dividend yield compare to U.S. Treasury yields (currently 4–4.5% on two-year notes)?
A. Pure cash yield favors Treasuries. SCHD, however, blends dividend income with stock-price appreciation. Five-year cumulative +56.1% reflects combined returns, not dividend alone. Treasuries lock in rates until maturity, exposing holders to inflation risk. Dividend stocks historically track inflation, providing price-level hedge. Portfolio-wide balance between fixed income and equities proves optimal, not either-or selection.
Q3. Historically, does VIG or SCHD deliver better long-term returns?
A. Five-year data shows VIG at +71.5% versus SCHD at +56.1%, favoring VIG. VIG emphasizes dividend-growth companies, capturing larger capital appreciation. SCHD dividend yield outpaces at 3.25% vs 1.47%. If current cash matters most, SCHD leads. If capital gains dominate, VIG historically won. Over 15+ years, dividend-growth compounding may favor VIG. Past performance, however, carries no future guarantee.
Q4. Tax treatment of SCHD dividends—which account structure minimizes taxes?
A. Tax-advantaged accounts (Roth IRA, Traditional IRA, 401(k)) prevent immediate tax on dividend income. Non-qualified brokerage accounts face federal tax on qualified dividends (~20% for most earners) plus state tax where applicable. Annual tax drag could reach 25–35% of dividend income in taxable accounts. Tax-deferred structures preserve the full dividend for compounding. Account selection materially affects net returns.
Q5. SCHD trades near 52-week highs—is current entry advisable?
A. Dollar-cost averaging (regular monthly or quarterly purchases) removes timing pressure. Averaging spans highs, lows, and midpoints, reducing average purchase cost. If short-term 10%+ correction likelihood seems elevated, phased entry spreads risk. Current 85.7% of 52-week range signals relative elevation but not absolute prohibition. Timing perfection is impossible; systematic purchasing offsets this uncertainty.
Synthesis: SCHD Within Dividend-Maximization Strategy
SCHD’s 2.7% quarterly dividend reduction reads as a weakness superficially. Combined with 3.25% yield sustained, P/E 18.8 showing relative undervaluation, and five-year +56.1% cumulative performance, the narrative diverges.
For dividend-maximization investors, SCHD remains a front-tier candidate. Three reasons surface.
First: 3.25% yield stands 2.7x above market average and carries capital-appreciation potential when compared against Treasury yields (4–4.5%).
Second: Conservative dividend management signals stability rather than risk. Proactive adjustment beats forced, sharp reductions—a long-term investor preference.
Third: Yield results from both dividend cash and capital appreciation. Five-year +56.1% exceeds what dividends alone could generate; underlying-asset price growth contributes meaningfully.
Two items warrant constant attention: whether quarterly cuts persist and where P/E 18.8 reprices during market corrections.
If cash distribution priority ranks highest, SCHD maintains top standing. If long-term appreciation takes precedence, blending VIG (lower 1.47% yield but five-year +71.5% performance) presents an alternative. Portfolio objectives and prevailing market conditions ultimately shape the allocation decision—the essence of yield optimization.
This site is supported by Google AdSense advertising revenue. We receive no compensation or sponsorship from any ETF, broker, or financial product.