- SCHD current yield 3.29% at $31.8 — 94.9% of 52W range ($25.69–$32.13), not a distressed-entry scenario
- 1Y return +27.0%; 5Y cumulative +47.1% — dividends contributed ~3.3 pts, price drove the rest
- VIG 5Y return +61.9% outpaces SCHD by 14.8 pts — the yield premium has a total-return cost
- SCHD P/E 18.9 vs VIG 26.8 — value tilt is real but concentrated in rate-sensitive sectors
- AUM $91.1B, avg daily volume 23M shares — liquidity not a constraint at any allocation size
SCHD trades at $31.8, sitting at 94.9% of its 52-week range. For yield-maximizers, that positioning matters: buying near highs compresses starting yield and extends the payback window on any drawdown. The real question is not entry timing — it is whether the dividend growth engine underneath compounds fast enough to justify that cost.
Yield Decomposition: What 3.29% Actually Contains

At $31.8 and 3.29% yield, SCHD generates roughly $1.05 in annual dividends per share. That number is a snapshot. The compounding argument rests on the growth rate beneath it. Per Schwab fund data [ETF Database], SCHD’s annual dividend has grown approximately 11% per year since its 2011 inception — investors who purchased near $35 in 2015 are collecting a yield-on-cost above 5% today. That gap between stated yield and yield-on-cost is where the long-term income thesis lives.
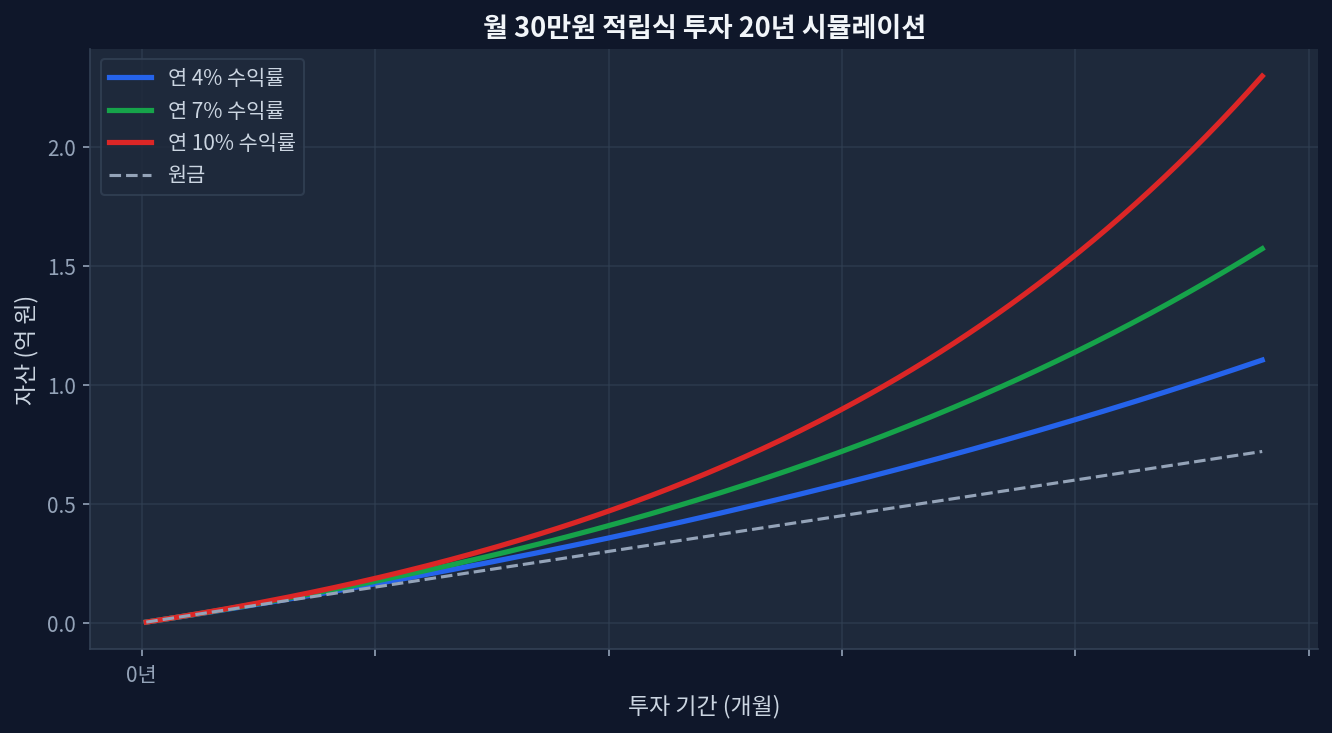
The DCA simulation below (20-year monthly contributions at 4%, 7%, and 10% annual growth rates) makes the trajectory concrete. At 7% growth — roughly splitting the difference between SCHD’s dividend CAGR and its total return — the income stream at year 20 runs nearly 4x year-1 levels. Starting yield matters less than growth rate over a 20-year horizon. The investor who anchors on 3.29% and ignores the growth rate is reading only half the decomposition.
SCHD vs VIG: The Yield Premium Has a Price
Both ETFs charge 0.06% and screen on dividend growth quality. The split is in what “quality” emphasizes. VIG trades at $230.87 — 98.8% of its 52-week range ($193.01–$231.31), actually closer to its ceiling than SCHD is to its own.
| ETF | Yield | P/E | 5Y Return | 1Y Return | AUM |
|---|---|---|---|---|---|
| SCHD | 3.29% | 18.9 | +47.1% | +27.0% | $91.1B |
| VIG | 1.50% | 26.8 | +61.9% | +20.2% | $124.6B |
VIG’s 5-year return of +61.9% outpaces SCHD’s +47.1% by 14.8 percentage points [Yahoo Finance]. The market prices VIG holdings at P/E 26.8 — a 42% premium over SCHD’s 18.9. Yield-maximizers collect more income now; total-return investors have the data for the 2020–2025 window. This diverges from the standard narrative that SCHD is the superior dividend compounder: on total return, for that period, it was not.
Where the 3-Year CAGR Number Misleads
SCHD’s 3-year cumulative return of +51.9% implies roughly 15% annualized — but that window begins near the 2022 drawdown trough, which flatters the metric [Morningstar]. The 5-year figure of +47.1% — approximately 8% annualized — is more representative of a full cycle and a realistic dividend-growth-ETF expectation.
Contrarian read: SCHD’s value tilt has benefited from a specific rate and sector regime. Financials and industrials — core SCHD weights — outperformed in 2022–2024. If the macro environment rotates toward growth or defensives, that same tilt becomes a headwind. At $91.1B AUM, index rebalancing at quarter-end creates measurable price impact in underlying holdings — a structural friction that did not exist when the fund was a fraction of this size.
Scenarios Where This Analysis Could Miss
Three breaks in the thesis. Financial-sector dividend cuts — which materialized briefly in 2020 — would compress yield and price simultaneously, the worst outcome for an income-growth thesis. Rate normalization below 3% could trigger rotation away from value and dividend toward growth, eroding SCHD’s price contribution to total return. And if VIG’s P/E of 26.8 is justified by structurally faster earnings growth rather than multiple expansion, SCHD’s apparent discount reflects slower underlying earnings power rather than mispricing — a fundamentally different read on the same valuation gap.
At 94.9% of the 52-week range, a margin-of-safety argument requires scrutiny. The data does not support a distressed-entry thesis at $31.8.
Frequently Asked Questions
What is SCHD’s 10-year dividend CAGR?
Approximately 11% annually since 2011 per Schwab fund data — well above the current 3.29% stated yield because significant price appreciation has compressed yield-on-cost for new buyers entering today.
Is SCHD or VIG better for dividend growth investing?
SCHD yields 3.29% vs VIG’s 1.5% — more than double current income. But VIG’s 5-year total return (+61.9%) outpaced SCHD (+47.1%) by 14.8 points. The answer depends on objective: higher current income or higher total return over time.
What does yield decomposition reveal about SCHD?
Of SCHD’s +27.0% 1-year return, dividends contributed roughly 3–3.5 percentage points while price appreciation drove the rest. In flat-market years, the income share rises — precisely when SCHD’s design advantage is most visible versus pure growth ETFs.
Is SCHD near its 52-week high in 2025?
Yes. At $31.8 against a 52W high of $32.13, SCHD sits at 94.9% of its annual range. Not a distressed-entry scenario; new capital enters with a compressed margin of safety on yield.
How does SCHD’s P/E compare to VIG?
SCHD P/E 18.9 vs VIG 26.8 — a 42% valuation gap. SCHD’s value tilt is real but concentrated in rate-sensitive sectors where earnings can compress quickly during credit tightening cycles.
📊 Verify this data yourself
import yfinance as yf
t = yf.Ticker("SCHD")
t.history(period="5y")["Close"].pct_change().add(1).cumprod()