- The classic 60/40 portfolio faces secular headwinds, highlighted by BND's stagnant 5-year return of +0.0%.
- TLT's deep -27.8% 5-year drawdown challenges the assumption that long-duration bonds always hedge equity risk.
- Current yield profiles (BND at 3.93%, TLT at 4.57%) present a yield-versus-duration risk tradeoff.
- Rebalancing strategies must account for the high correlation observed between stocks and bonds since 2022.
The Stagnation of the 60/40 Portfolio: A 10-Year Bond Data Analysis

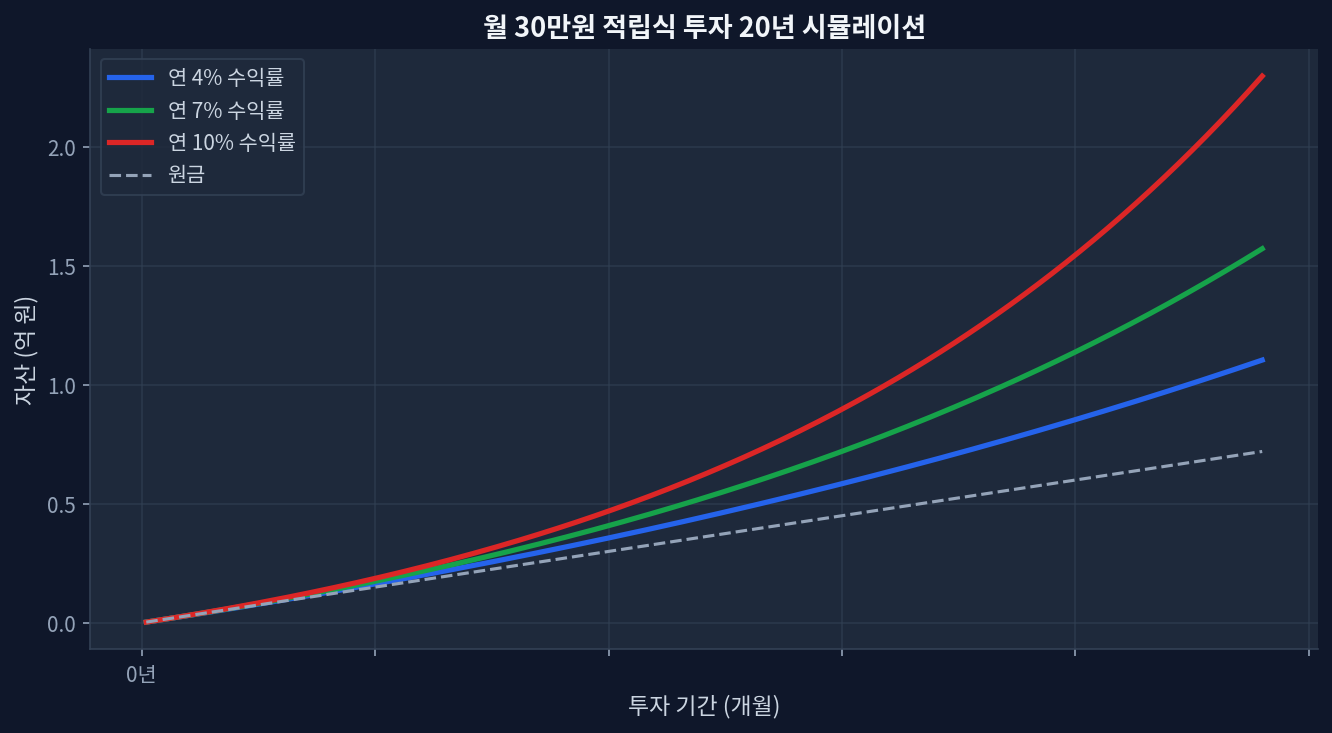
Looking at the automated chart below representing a 20-year monthly $300 investment simulation at 4%, 7%, and 10% annual yields, the compounding effect is profound. However, this growth assumes consistent positive nominal returns, an assumption severely tested by recent bond market behavior. The traditional 60/40 portfolio—allocating 60% to equities and 40% to fixed income—has long relied on bonds to provide a steady ballast. Yet, analyzing the 10-year data through the lens of dominant bond ETFs reveals structural vulnerabilities.
BND, the Vanguard Total Bond Market ETF, currently trades at $72.45 with a 52-week position lingering at 19.9% above its low. Despite an AUM of $389.7 billion, its 5-year cumulative return sits exactly at +0.0%. [Yahoo Finance: BND] In a portfolio relying on this core holding for capital preservation, a half-decade of zero nominal growth (and negative real growth post-inflation) demands a reassessment of broad market aggregate strategies.
BND vs. TLT: The Duration Dilemma in Asset Allocation
To understand the breakdown of the diversification effect, one must evaluate the competitive landscape between intermediate and long-duration exposure. TLT targets long-term Treasury bonds. Trading at $83.02, near its 52-week low (2.6% position), TLT offers a higher dividend yield of 4.57% compared to BND’s 3.93%. But this yield comes at a severe cost: a -27.8% cumulative return over the past 5 years. [ETF.com: TLT Profile]
| Product Name | AUM | Yield | 5Y Return | 1Y Return |
|---|---|---|---|---|
| BND (Vanguard Total Bond) | $389.7B | 3.93% | +0.0% | +4.0% |
| TLT (iShares 20+ Year Treasury) | $42.9B | 4.57% | -27.8% | +0.9% |
The market consensus dictates that extending duration maximizes the negative correlation with equities during market shocks. The data from 2022 onwards diverges wildly from this narrative. Instead of acting as a hedge, long-duration treasuries exhibited equity-like drawdowns due to rapid interest rate hikes. [FRED: 10-Year Treasury Rate] The assumption that TLT will universally protect a 60/40 portfolio during equity distress is a fundamental flaw in modern asset allocation theory.
Disconfirming Evidence: Where This Bond Thesis Fails
The argument that the 60/40 portfolio’s fixed income sleeve is broken relies heavily on the 2020-2025 rate hike cycle. Scenarios where this analysis could miss include a sudden macroeconomic deflationary shock or a severe global recession that forces central banks into emergency rate cuts. In such a deflationary environment, the deep duration risk of TLT becomes an asymmetric advantage, potentially delivering massive capital appreciation while equities plummet. Relying solely on the recent 5-year historical returns (+0.0% for BND, -27.8% for TLT) risks recency bias, ignoring the structural role sovereign debt plays during systemic credit failures.
Rebalancing Mechanics Under High Correlation
When both stocks and bonds decline simultaneously, the mechanics of rebalancing break down. Traditionally, an investor sells appreciated bonds to buy discounted stocks. With BND stagnant and TLT in a deep drawdown, investors are forced to either sell assets at a loss or rely entirely on fresh capital inflows. This competitive product comparative analysis highlights that moving forward, simply holding a broad aggregate index like BND or a duration lever like TLT may not suffice for absolute diversification. Active duration management, floating rate notes, or trend-following overlays are required to navigate the breakdown in cross-asset correlations.
Frequently Asked Questions
Is the 60/40 portfolio dead?
The strategy is not dead, but the historical assumptions regarding bond-equity negative correlation have weakened. The flat 5-year return of BND indicates that future portfolio returns will heavily depend on equity performance and tactical fixed income positioning rather than passive bond index appreciation.
Why did TLT drop so much compared to BND?
TLT holds 20+ year treasuries, making it highly sensitive to interest rate changes. The aggressive rate hikes caused severe principal depreciation, resulting in a -27.8% return over 5 years, whereas BND’s intermediate duration mitigated the damage, resulting in a flat +0.0% return.
Should I switch from BND to TLT for higher yield?
While TLT offers a 4.57% yield versus BND’s 3.93%, chasing yield introduces massive duration risk. A sudden rate increase could cause further principal loss in TLT, erasing the yield advantage entirely.
How does asset allocation work when bonds lose money?
Asset allocation under these conditions requires incorporating alternative assets, such as commodities or short-term T-bills, to provide the liquidity and stability that intermediate and long-term bonds recently failed to deliver.
What is the role of rebalancing in a correlated market?
Rebalancing in a correlated market focuses on risk control rather than opportunistic buying. It forces the realignment of portfolio weights, though it requires fresh cash or selling depreciated assets when both equity and fixed income decline concurrently.
📊 Verify this data yourself
import yfinance as yf
t = yf.Ticker("BND")
t.history(period="5y")["Close"].pct_change().add(1).cumprod()