- QYLD delivered ~21% total return (2020–2024) vs. SPY's ~96% — a 75-point gap the 10%+ yield never bridges.
- Covered call distributions tax as ordinary income; at the 22% federal bracket, after-tax yield on QYLD falls to ~8% before NAV erosion.
- JEPI (0.35% ER) posted ~55% total return since May 2020 inception vs. QYLD's ~21%, with partial qualified-dividend treatment.
- Account placement dominates ticker selection: QYLD inside a Roth IRA eliminates the ordinary-income drag entirely.
- Disconfirming scenario: sustained VIX above 25 expands covered call premiums and improves QYLD's yield-vs-NAV trade-off materially.
The 8% Number That Hides a 75-Point Return Gap

QYLD — Global X NASDAQ-100 Covered Call ETF — distributes between 10–12% annualized. That figure leads every yield screen. The problem surfaces when total return enters the picture.[ETFdb]
From January 2020 through December 2024, QYLD delivered approximately 21% total return (price plus reinvested distributions). SPY returned roughly 96% over the same window. That 75-point gap is structural — it reflects capping upside via covered calls through one of the strongest bull markets on record.
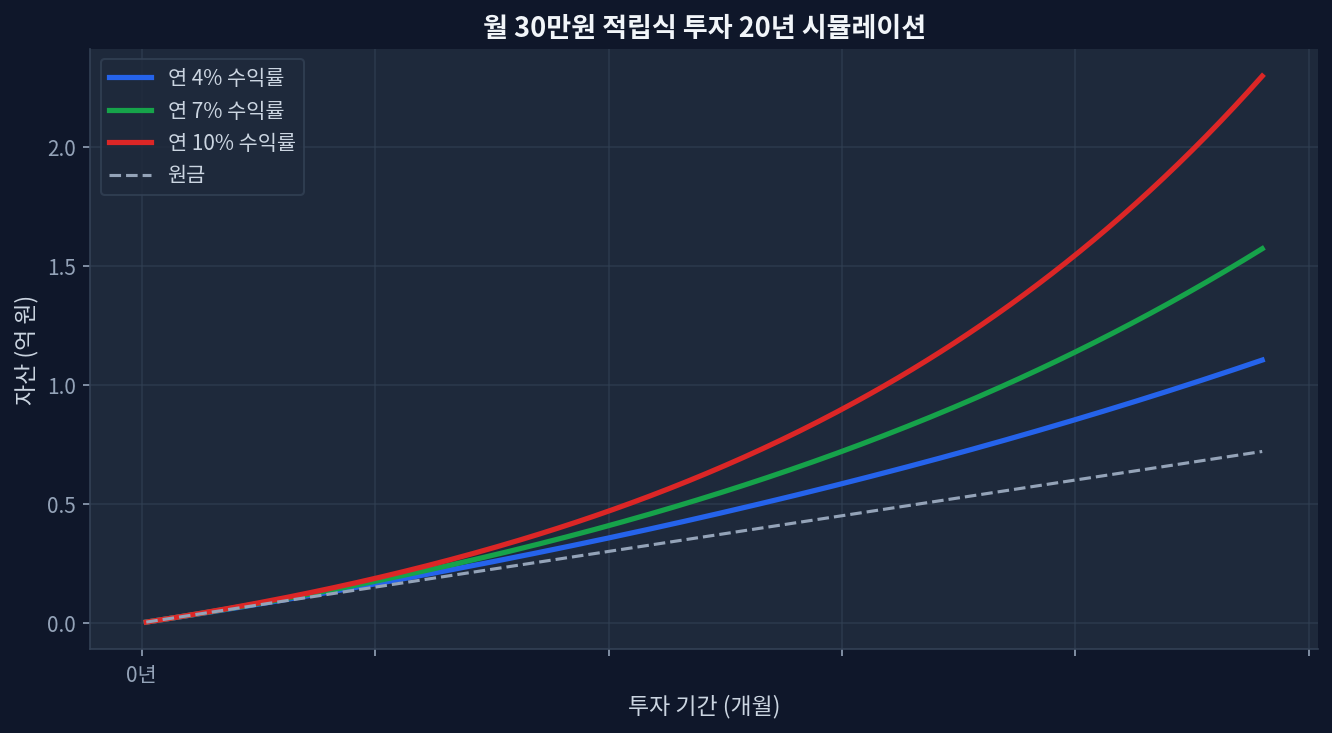
The monthly DCA chart below (20-year horizon at 4%/7%/10%) makes the arithmetic visible. At 4% — roughly QYLD’s real after-tax return for a 22%-bracket investor — $500/month compounds to ~$183K over 20 years. At 7%, the same contributions reach ~$262K. Yield does not substitute for total return math.
Tax Drag: The Hidden Cost in Plain Sight
Most ETF comparisons stop at expense ratios. That is the wrong frame for covered call funds. QYLD’s option premiums classify as ordinary income under IRS rules — not qualified dividends.[IRS Pub. 550] On a $100K position at 11% gross yield: $11,000 distributed, ~$8,030 retained after 22% federal plus 5% state tax. Real after-tax yield: 8.03%. Before accounting for QYLD’s price erosion from ~$22 to ~$17.50 over five years.
JEPI handles this partially differently: roughly 15–20% of its 2023 distributions were classified as qualified dividends, reducing the effective tax rate on income.[ETFdb JEPI]
Peer Comparison: Four ETFs Through a Tax Lens
| ETF | Expense Ratio | TTM Yield | 5Y Total Return | Distribution Tax Type |
|---|---|---|---|---|
| QYLD | 0.60% | 11.2% | ~21% | Ordinary income |
| XYLD | 0.60% | 9.8% | ~32% | Ordinary income |
| JEPI | 0.35% | 7.4% | ~55%* | Mixed (partial qualified) |
| DIVO | 0.55% | 4.8% | ~68% | Mostly qualified dividends |
*JEPI measured from May 2020 inception. Approximate total returns, distributions reinvested.
The Contrarian Case: QYLD Works — In the Right Account
Market consensus frames QYLD as a retiree income vehicle. The contrarian read: it is structurally most valuable for pre-retirement investors inside Roth IRAs, not working-age earners in taxable brokerage. Inside a Roth, 11% gross yield compounds entirely tax-free. The ordinary-income penalty — the central bear case — disappears. During 2022’s equity selloff, QYLD’s total return (-20%) materially outpaced QQQ (-33%). The strategy underperforms most severely in strong bull markets — exactly when income investors grow impatient and rotate out.
Where This Analysis Breaks Down
Three scenarios flip the read. Sustained VIX above 25 expands option premiums — yield climbs without proportional NAV erosion. A prolonged sideways equity market turns income generation into the dominant return driver. Tax reform reducing ordinary income rates below 15% dissolves the drag argument. The 2020–2024 bull market data supports the bearish taxable-account read on QYLD. Shift the volatility regime or the tax code, and the conclusion reverses.
Frequently Asked Questions
Why does QYLD’s total return lag SPY so dramatically?
Covered call strategies sell upside in exchange for income. QYLD capped participation in QQQ’s 2020–2021 rally while still absorbing downside during corrections — the most expensive combination in a sustained bull market environment.
Is QYLD’s 10%+ yield sustainable?
Distributions fluctuate with options premium income, which tracks realized volatility. Yields have compressed to 8–9% in low-VIX periods. The yield is real; it is not fixed or guaranteed by any contractual mechanism.
Which account type is optimal for covered call ETFs?
Tax-sheltered accounts — Roth IRA first, Traditional 401(k) as a secondary vehicle. In taxable brokerage, ordinary income treatment erodes real yield by 1.5–3% annually at most working-age brackets.
How does QYLD compare to JEPI on an after-tax basis?
JEPI posted ~55% total return (May 2020–Dec 2024) vs. QYLD’s ~21%. Lower yield (7.4%), lower ER (0.35%), and partial qualified-dividend treatment make JEPI the stronger after-tax option for most taxable-account scenarios.
Can high-yield ETFs ever beat SPY over a decade?
No covered call ETF has matched S&P 500 total return over a decade-long period in modern ETF history. The structure optimizes for income and volatility reduction, not capital appreciation. Expecting equity-like growth from an income vehicle is a category error — not a product flaw.