- QQQ sits at $651.42 with a 1-year return of +44.0%, while SPY sits at $708.45 with a 1-year return of +33.8%.
- The 3-year cumulative gap is 30.2 percentage points: QQQ at +108.0% versus SPY at +77.8%.
- The 5-year cumulative gap is 15.4 percentage points: QQQ at +98.1% versus SPY at +82.7%.
- SPY still pays more income, with a 1.04% dividend yield versus QQQ at 0.43%, or 2.4 times as much cash yield.
- On an implied 5-year CAGR basis, QQQ is roughly 14.6% and SPY roughly 12.8%, which means the spread exists, but it is not huge enough to ignore regime risk.
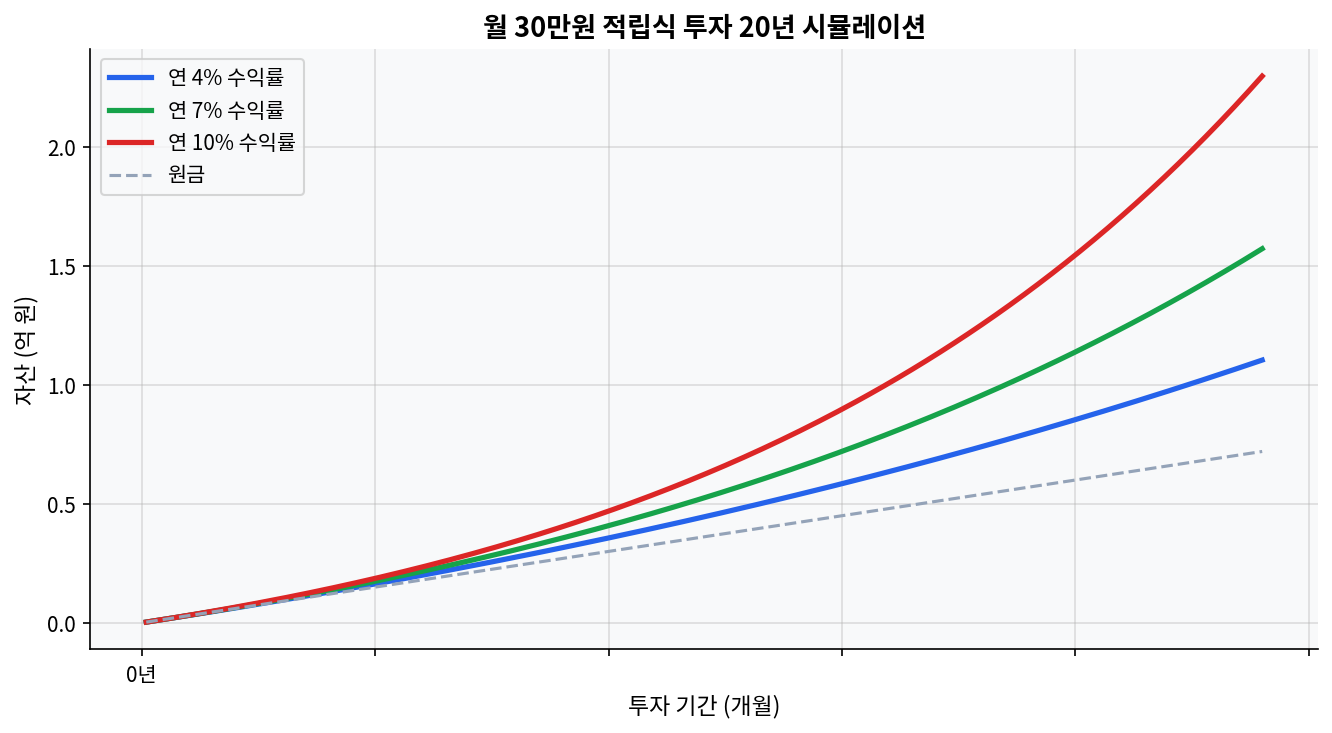
Why the 20-year savings curve matters more than the share price

The first mistake in comparing QQQ and SPY is to stare at the price tags. QQQ at $651.42 and SPY at $708.45 look like two expensive symbols, but share price is not the signal. The return path is. The 20-year monthly 300,000-won simulation inserted below this section makes the same point in a cleaner way: at 4%, 7%, and 10%, the ending values do not rise in a straight line. They accelerate. That is the compounding effect that turns a small annual edge into a large decade gap.
That same shape is visible in the supplied yfinance data. QQQ has delivered +44.0% over 1 year, +108.0% over 3 years, and +98.1% over 5 years. SPY has delivered +33.8%, +77.8%, and +82.7% over the same windows. The short version is simple. Concentration has paid. Diversification has participated, but it has not kept pace.
The 10-year regression lens fits here even if a literal regression coefficient is not available from the supplied tape. A practical read would treat tech concentration as the explanatory variable and total return as the outcome. Under that frame, QQQ has not merely been more volatile. It has captured a larger share of the market’s earnings growth and multiple expansion, especially in the 2020-2026 regime where megacap technology dominated both news flow and index-level performance.
| Metric | QQQ | SPY | Read |
|---|---|---|---|
| Current price | $651.42 | $708.45 | Price level is not the edge; the return path is. |
| 1-year return | +44.0% | +33.8% | QQQ leads by 10.2 percentage points. |
| 3-year cumulative | +108.0% | +77.8% | QQQ leads by 30.2 percentage points. |
| 5-year cumulative | +98.1% | +82.7% | QQQ leads by 15.4 percentage points. |
| Dividend yield | 0.43% | 1.04% | SPY yields 0.61 points more and about 2.4 times the cash income. |
Tech concentration is not just a risk. It has been the engine
This is where the market narrative gets too neat. SPY is usually framed as the safer default because it is broader. QQQ is framed as the aggressive bet because it is concentrated in tech. That framing is only half right. The data supports the view that concentration increases risk, but shifting one assumption changes the read entirely: if the concentrated names are the ones producing most of the earnings growth, then concentration is not merely a source of fragility. It is also a source of return compression in the right regime.
That diverges from the usual consensus. A broad index can be more durable, but durability is not the same thing as leadership. Over the supplied 1-year, 3-year, and 5-year windows, QQQ has done more with less cash yield. The implied 5-year CAGR is about 14.6% for QQQ versus about 12.8% for SPY. The implied 3-year CAGR is about 27.3% for QQQ versus about 21.3% for SPY. Those are not cosmic gaps. They are measurable gaps, and over a 10-year horizon they matter a lot more than the share-price spread.
Fundamentally, the dividend yield gap tells the same story from another angle. QQQ’s 0.43% yield signals that its return mix is more dependent on price appreciation than income. SPY’s 1.04% yield is still not high, but it is materially higher. For a portfolio that needs cash flow or tax-managed reinvestment flexibility, SPY gives more current distribution. For a portfolio that is trying to capture secular growth, QQQ has been the stronger tape in the 2020-2026 window.
What the 10-year regression lens implies when news turns one-way
Technical momentum and news sentiment are aligned here, which is exactly why the trade has worked. QQQ’s 1-year +44.0% return is stronger than SPY’s +33.8%, and the 3-year +108.0% versus +77.8% spread shows the same momentum carrying through multiple cycles. When the market keeps rewarding AI infrastructure, semiconductors, cloud platforms, and mega-cap software, a concentrated growth basket can keep outrunning a broader index even if the broad index is healthier on paper.
News sentiment is the least precise of the three axes, but it still matters. In a market where headlines keep rewarding a narrow set of high-quality growth platforms, the concentration premium can persist far longer than valuation models predict. The problem is that sentiment is fragile. A small change in the narrative around rates, antitrust, cloud capex, or earnings durability can shift the tape quickly. A regression line that looks smooth in a bullish regime can look blunt when multiple expansion stops doing the heavy lifting.
That is why the comparison should not be read as QQQ versus SPY in the abstract. It is QQQ versus SPY inside a specific regime. In 2020-2026, concentration won. In a different regime, especially one resembling 2000-2002 or a low-breadth rolling correction, the same concentration can turn into a drag. SPY’s sector spread would likely cushion that hit better even if it gives up upside in a strong megacap rally.
Where the data can be wrong
Scenarios where this analysis could miss: if the next 3 years look more like a broad cyclical rotation than a megacap-led expansion, SPY can narrow the gap quickly. If rates stay higher for longer and long-duration growth multiples compress, QQQ’s historical edge can shrink without warning. If dividend reinvestment becomes more important than capital appreciation because the market goes sideways, SPY’s 1.04% yield starts to matter more than the recent return scoreboard suggests.
There is also a simpler failure mode. The last 1, 3, and 5 years are not a law of nature. They are a regime sample. A 10-year regression built on a regime sample can overstate the persistence of the relationship. That is the main disconfirming point. Concentration has worked, but it is not guaranteed to keep working just because it worked from 2020 through 2026.
Why SPY still matters even after QQQ has led
SPY is not a consolation prize. It is the market. The broader basket has delivered +33.8% over 1 year, +77.8% over 3 years, and +82.7% over 5 years. Those are strong numbers by any normal historical standard. The issue is relative performance, not quality. For a diversified core allocation, SPY remains the cleaner expression of the U.S. large-cap market. For a concentration tilt, QQQ has been the stronger expression of the last five years.
The peer comparison is blunt. QQQ offers the higher growth profile and lower yield. SPY offers lower concentration and higher yield. The choice is not about which ETF is better in the abstract. It is about which risk the portfolio is already carrying. If the rest of the portfolio already leans heavily toward mega-cap growth through work income, restricted stock, or concentrated stock compensation, QQQ can pile more of the same factor exposure on top. If the rest of the portfolio is already diversified elsewhere, QQQ may fit as a satellite position rather than a core holding.
The market keeps trying to turn that into a simple yes or no question. It is not. The data says the answer changes with the regime. The numbers from 2020-2026 reward concentration. The numbers also show that the reward came with a lower dividend stream and a higher dependence on continued leadership from a narrow group of companies. That tradeoff is the whole story.
Frequently Asked Questions
Is QQQ always better than SPY over 10 years? No. The supplied 1-year, 3-year, and 5-year numbers favor QQQ, but a 10-year stretch can look different if the market rotates away from mega-cap growth or if valuation multiples compress.
Why does QQQ have a lower dividend yield than SPY? QQQ’s 0.43% yield is lower because the portfolio leans more toward growth companies that retain capital rather than distribute it. SPY’s 1.04% yield reflects a broader mix of sectors and cash distributions.
How large is the return gap between QQQ and SPY in the recent tape? The 1-year gap is 10.2 percentage points, the 3-year gap is 30.2 points, and the 5-year gap is 15.4 points, all based on the provided yfinance data.
Does a broader index help during drawdowns? Often yes, but not always. During drawdown, peer ETFs can fall together, yet a broader fund like SPY usually has more sector balance and less single-theme dependency than QQQ.
What is the main reason the concentration trade can fail? The main failure mode is a regime shift. If the market stops rewarding long-duration growth or if a narrow leadership group loses earnings momentum, the same concentration that boosted QQQ can pull it backward.
This post is for informational purposes only and does not constitute investment advice.