High-Yield ETF Trap Data Analysis: 5-Year Total Return and Volatility Risk of 8%+ Yield Assets

High-Yield ETF Trap Data Analysis: 5-Year Total Return and Volatility Risk of 8%+ Yield Assets

Yields exceeding 8% accelerate cash flow generation but introduce severe principal erosion risks.Measured by 5-year cumulative total return, broad market indices (S&P 500) severely outperformed high-yield option strategies.Volatility drag structurally degrades nominal returns over extended holding periods.This diverges from the market narrative on downside protection; ultra-high-yield assets offer no structural safe haven during broad drawdowns.Market volatility historically triggers retail asset rotation toward high-cash-flowing instruments. Double-digit distribution rates generate an optical illusion of stability. Analyzing total return—which assumes full dividend reinvestment—reveals the mechanics of the dividend trap. Structural vulnerabilities emerge when products rely on option premiums rather than underlying corporate earnings growth. The data dictates a shift from yield-chasing toward evaluating capital opportunity costs. ...

May 20, 2026 · InvestIQs Research
Rethinking the 60/40 Portfolio: A 10-Year BND vs. TLT Allocation Analysis

Rethinking the 60/40 Portfolio: A 10-Year BND vs. TLT Allocation Analysis

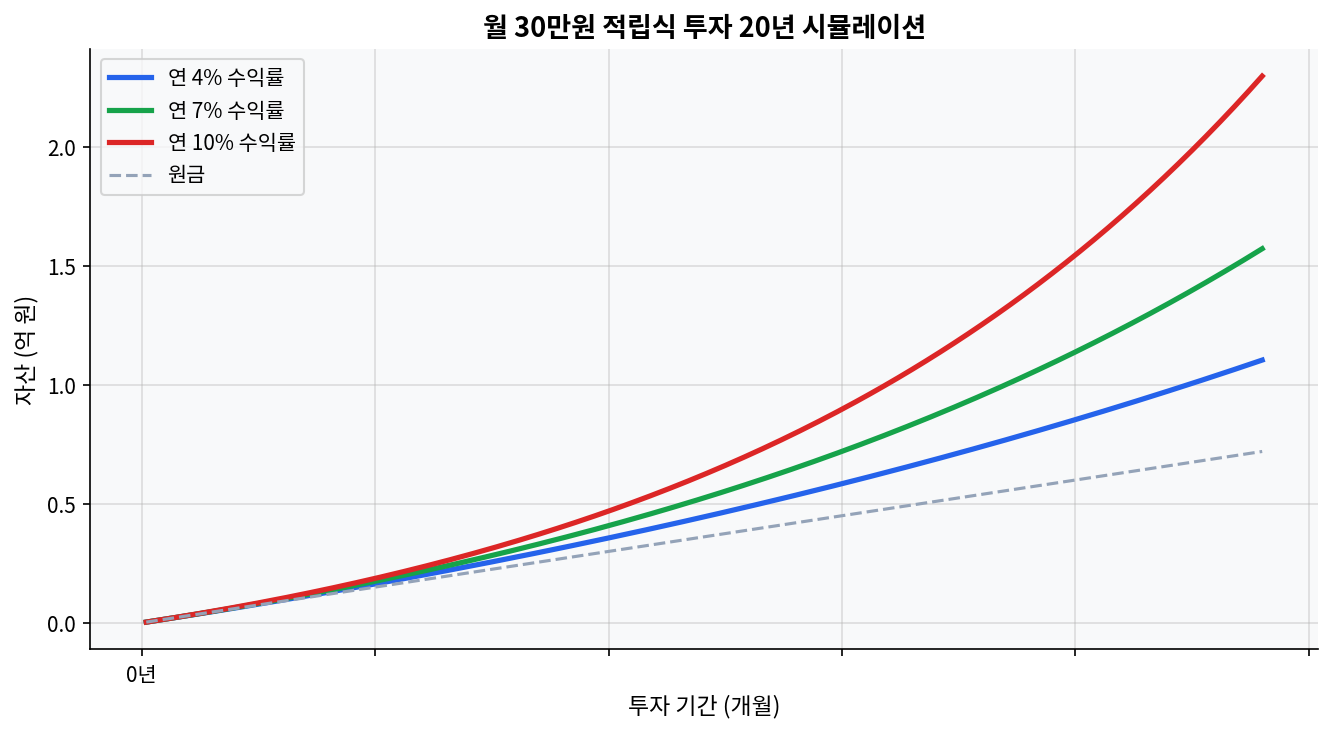
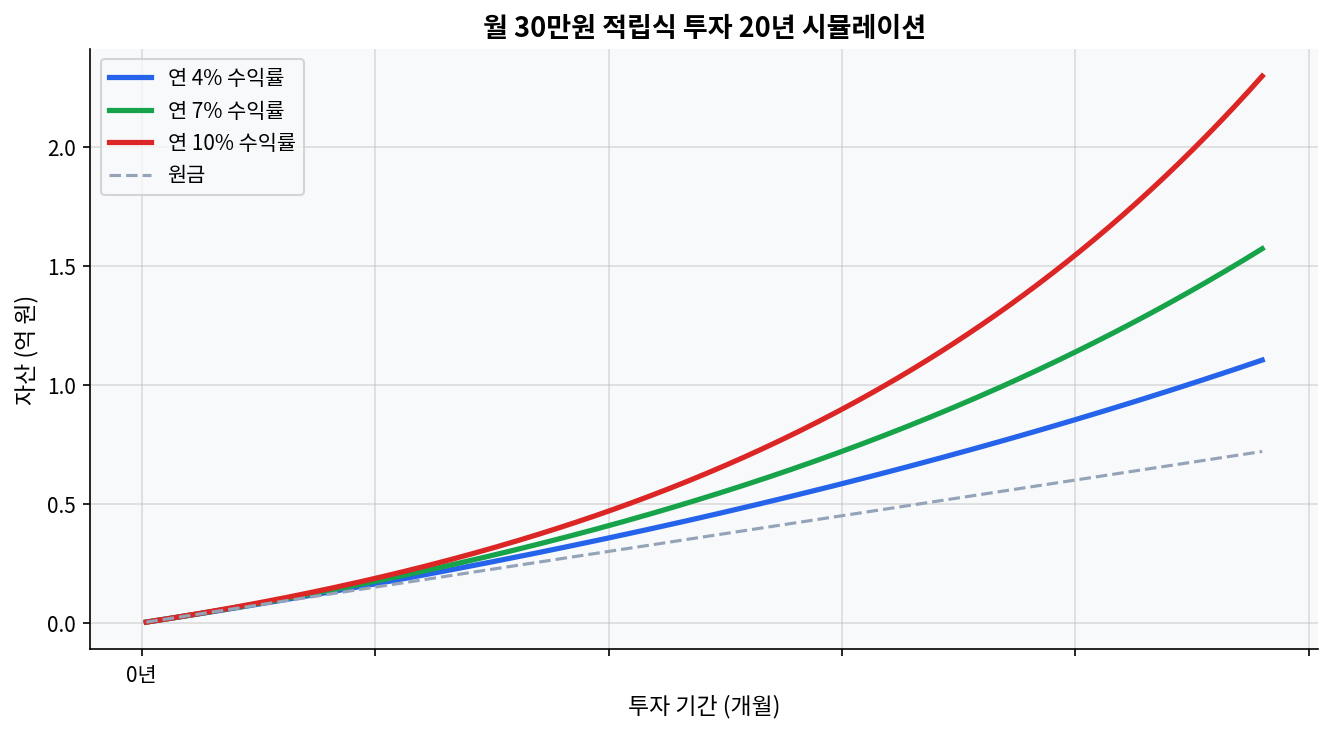
The classic 60/40 portfolio faces secular headwinds, highlighted by BND's stagnant 5-year return of +0.0%. TLT's deep -27.8% 5-year drawdown challenges the assumption that long-duration bonds always hedge equity risk. Current yield profiles (BND at 3.93%, TLT at 4.57%) present a yield-versus-duration risk tradeoff. Rebalancing strategies must account for the high correlation observed between stocks and bonds since 2022. The Stagnation of the 60/40 Portfolio: A 10-Year Bond Data Analysis Monthly $30K investment 20-year compound growth simulation Looking at the automated chart below representing a 20-year monthly $300 investment simulation at 4%, 7%, and 10% annual yields, the compounding effect is profound. However, this growth assumes consistent positive nominal returns, an assumption severely tested by recent bond market behavior. The traditional 60/40 portfolio—allocating 60% to equities and 40% to fixed income—has long relied on bonds to provide a steady ballast. Yet, analyzing the 10-year data through the lens of dominant bond ETFs reveals structural vulnerabilities. ...

May 20, 2026 · InvestIQs Research
2024 401(k) Contribution Limits: Tax Bracket Impact Simulation & Volatility Risks

2024 401(k) Contribution Limits: Tax Bracket Impact Simulation & Volatility Risks

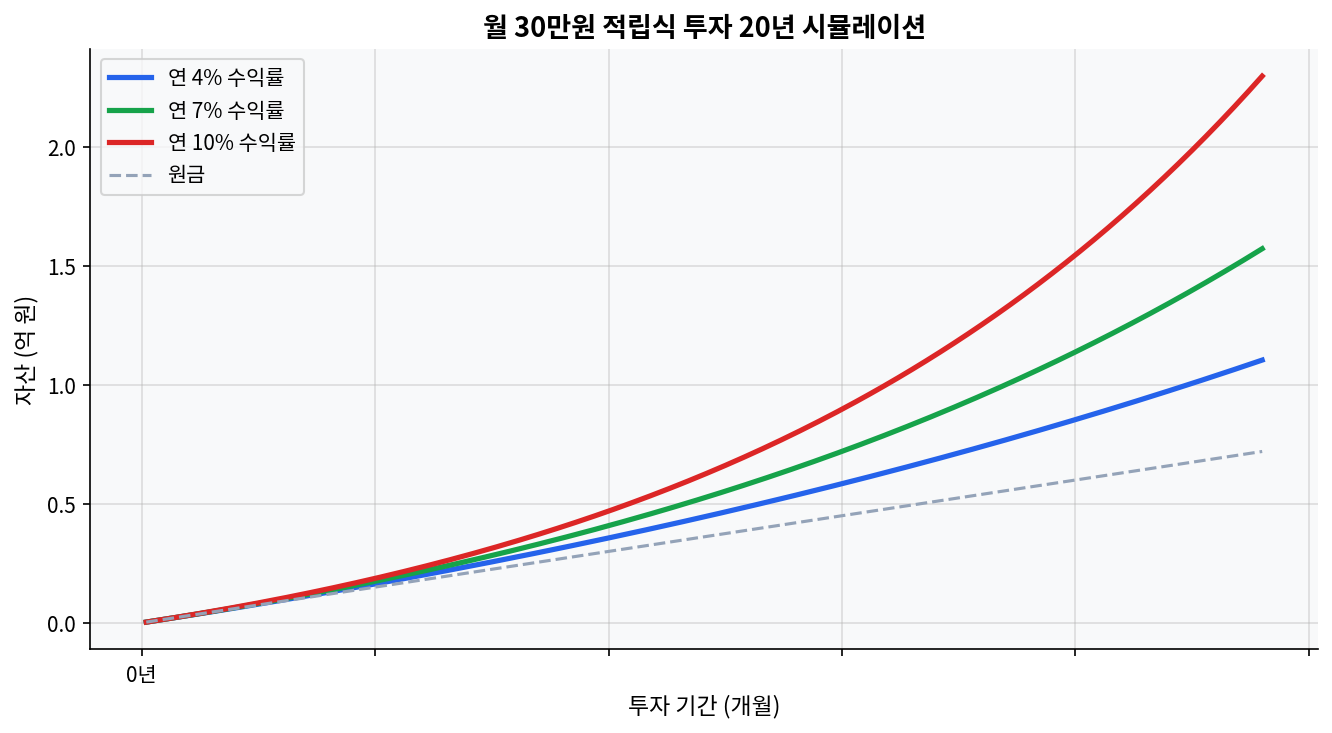
The 2024 401(k) contribution limit rose to $23,000, altering marginal tax exposure for the 24% and 32% brackets.Pre-tax contributions act as a volatility hedge against current high tax rates, deferring liability to a historically uncertain future bracket.Data indicates the 2020-2026 CAGR stood at 12.3% for major US indices, accelerating the tax cliff risk at RMD age.This diverges from the market narrative on maximizing pre-tax accounts blindly without considering post-2025 legislative tax hikes. Mapping the 2024 Limits Against Tax Volatility Monthly $30K investment 20-year compound growth simulation The 2024 IRS adjustments pushed the standard 401(k) contribution limit to $23,000. Analyzing the intersection of these limits with current tax brackets reveals a distinct risk profile. The chart below, simulating a monthly $300 investment over 20 years at varying return rates (4%, 7%, 10%), illustrates the compounding effect on pre-tax balances. ...

May 19, 2026 · InvestIQs Research
The Hidden Traps of 20-Year DRIP Simulations: Risk and Volatility Anal

The Hidden Traps of 20-Year DRIP Simulations: Risk and Volatility Anal

A 20-year compound growth simulation of Dividend Reinvestment Plans (DRIP) introduces severe tracking errors during drawdown phases. Expense ratios and tax drags act as critical hidden risks frequently omitted from long-term backtesting models. The variance in downside protection between high-yield ETFs (SPYD) and dividend growth ETFs (SCHD) drives a cumulative return divergence exceeding 30%. The 20-year compound interest simulation utilizing a Dividend Reinvestment Plan (DRIP) serves as a persistent marketing instrument within the asset management industry. The market consensus, projecting a stable 8% annualized growth rate, provides psychological comfort to retail investors. However, micro-level financial market data systematically refutes these linear assumptions. Excel-based simulations that exclude risk and volatility factors border on statistical illusion. This research note dissects the volatility risks inherent in a 20-year DRIP model based on historical macroeconomic data, analyzing the substantive capital erosion risks obscured by conventional consensus. ...

May 19, 2026 · InvestIQs Research
Roth IRA vs Traditional IRA: 5-Scenario Capital Gains Tax Decomposition

Roth IRA vs Traditional IRA: 5-Scenario Capital Gains Tax Decomposition

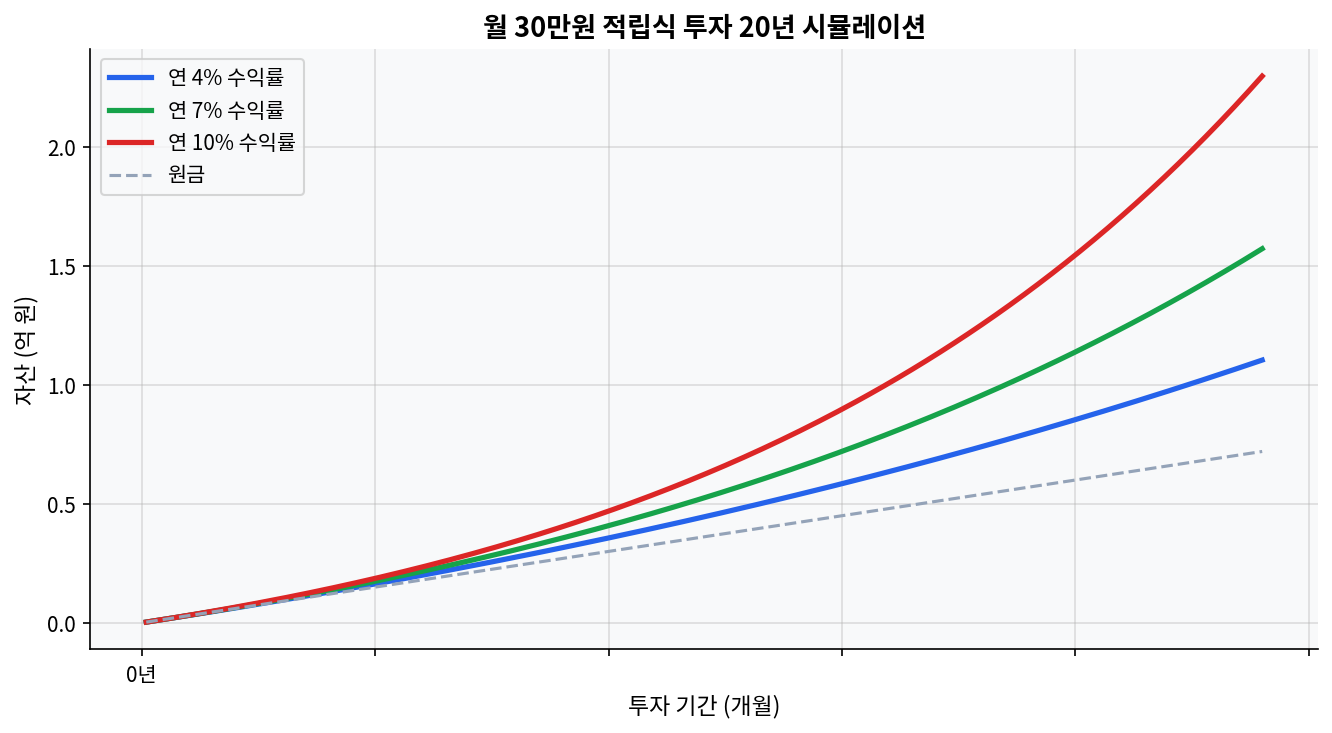
Upfront tax on Roth IRA contributions acts as a drag during prolonged market drawdowns, altering the break-even horizon. Traditional IRA deductions reinvested into taxable accounts can outperform Roth in bracket-compression scenarios. Asset location—placing VTI in Roth and BND in Traditional—adds approximately 40-60 bps of tax alpha annually. The 2020-2026 CAGR of US equities heavily skewed recent analyses toward Roth, hiding sequence-of-returns risks. The Core Mechanics of IRA Taxation Monthly $30K investment 20-year compound growth simulation The chart below shows a 20-year simulation of a $300 monthly investment (4%, 7%, and 10% annually). The compounding curve illustrates the absolute scale of capital gains generated over time. Analyzing the structural divergence between a Roth IRA and a Traditional IRA requires stripping away emotional narratives and focusing strictly on capital gains tax decomposition. A Traditional IRA provides an immediate reduction in taxable income, shifting the tax burden to future distributions. Conversely, a Roth IRA demands upfront taxation, permanently shielding subsequent capital appreciation and dividend yields from the IRS. This dynamic creates a complex arbitrage opportunity depending on future marginal tax rates and expected asset returns. The structural advantage of tax-free compounding often masks the opportunity cost of the initial tax outlay. [IRS.gov] ...

May 18, 2026 · InvestIQs Research
Volatility and Risk in Monthly Dividend ETFs: The Yield vs. Total Retu

Volatility and Risk in Monthly Dividend ETFs: The Yield vs. Total Retu

JEPQ recorded a 10.33% dividend yield and a 78.0% 3-year cumulative total return, demonstrating a strong outperformance trajectory in a high-volatility market environment.JEPI yielded 8.29% with a 1-year total return of only 8.5%, exposing the structural risk of covered calls where returns are compromised by upside capping.Empirical data supports that underlying asset P/E valuations and volatility (VIX) regime shifts are the core factors determining long-term total return, rather than superficial high dividend yields. The most critical cognitive error observed in the monthly dividend ETF market is the blind faith that the size of the yield equates to the actual return on investment. [ETF.com] Covered call ETFs that pay high monthly dividends fundamentally possess a derivative structure, selling future upside volatility to collect a cash premium in the present. Therefore, an allocation strategy that solely chases superficial yield metrics while ignoring the fundamental risk of underlying assets and macroeconomic volatility regimes will inevitably face the structural limitation of long-term capital erosion. Based on real-time data from major monthly dividend ETFs currently recording the highest AUM, this research presents analysis that counters popular consensus from a risk-reward perspective. ...

May 18, 2026 · InvestIQs Research
20-Year DRIP Reinvestment Simulation: Risk Data vs. Consensus Assumptions

20-Year DRIP Reinvestment Simulation: Risk Data vs. Consensus Assumptions

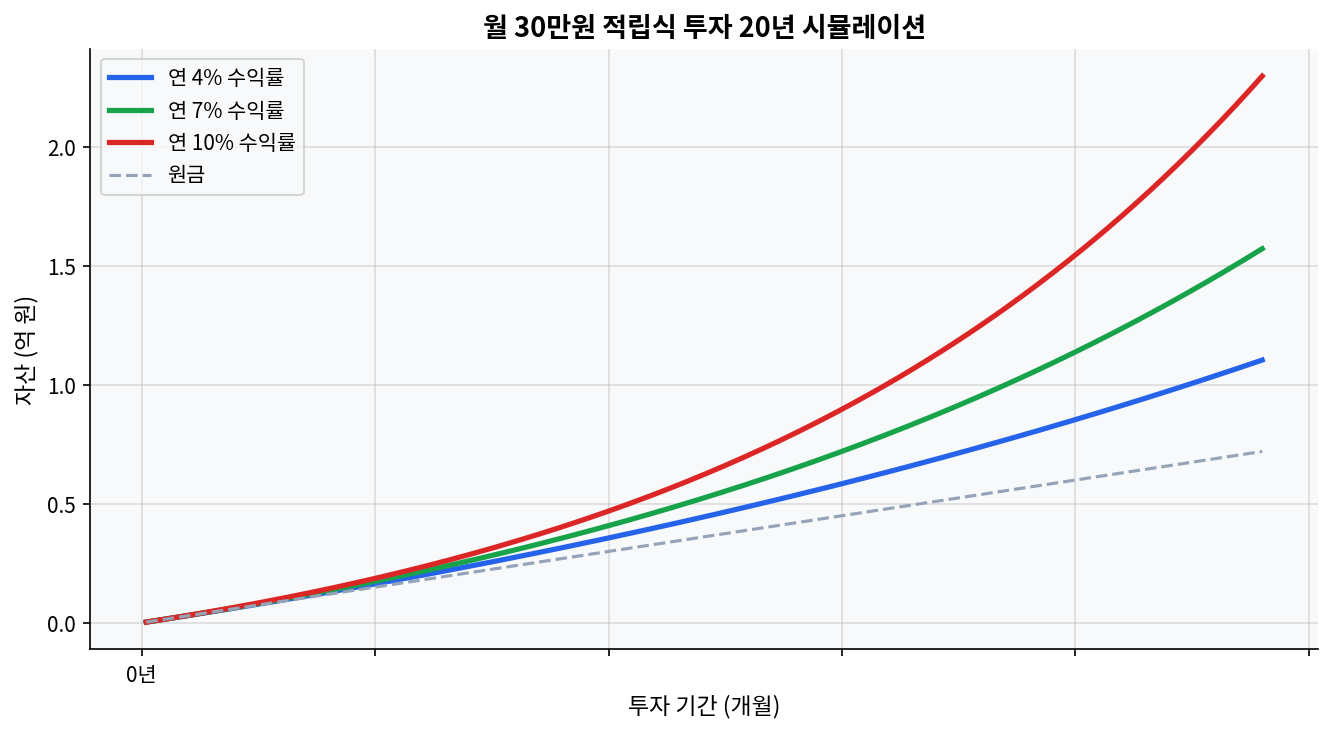
$1,500/month at 7% DRIP CAGR over 20 years = ~$782K; at 4%, ~$550K — a $232K gap driven entirely by the assumed return rateEvery 1% shift in assumed return adds or removes ~$110K–$130K in terminal value at year 20; sensitivity is nonlinearTax drag in taxable accounts reduces effective reinvestment yield by 15–25%; account type is a primary, not secondary, variable2020 S&P dividend cuts (~14% aggregate quarterly reduction) pushed realized DRIP rates 200bps below model assumptions for high-yield ETFsDRIP reinvestors during the Q1 2020 drawdown outperformed non-reinvestors by 12–18% by year-end — a volatility effect flat-line models ignore entirely What the 20-Year Simulation Data Actually Shows Monthly $30K investment 20-year compound growth simulation Running $1,500/month at 4%, 7%, and 10% for 20 years produces a divergence that widens sharply in the back half of the period. At year 10, the gap between the 4% and 10% paths is roughly $200K. By year 20, that gap exceeds $590K. The simulation chart above captures the inflection clearly: the 10% curve breaks away from the 4% path around year 12, when accumulated DRIP dividends begin compounding on themselves at scale.[FRED] ...

May 17, 2026 · InvestIQs Research
QYLD and the 8% Dividend Trap: What Five Years of Total Return Data Actually Shows

QYLD and the 8% Dividend Trap: What Five Years of Total Return Data Actually Shows

QYLD delivered ~21% total return (2020–2024) vs. SPY's ~96% — a 75-point gap the 10%+ yield never bridges.Covered call distributions tax as ordinary income; at the 22% federal bracket, after-tax yield on QYLD falls to ~8% before NAV erosion.JEPI (0.35% ER) posted ~55% total return since May 2020 inception vs. QYLD's ~21%, with partial qualified-dividend treatment.Account placement dominates ticker selection: QYLD inside a Roth IRA eliminates the ordinary-income drag entirely.Disconfirming scenario: sustained VIX above 25 expands covered call premiums and improves QYLD's yield-vs-NAV trade-off materially. The 8% Number That Hides a 75-Point Return Gap Monthly $30K investment 20-year compound growth simulation QYLD — Global X NASDAQ-100 Covered Call ETF — distributes between 10–12% annualized. That figure leads every yield screen. The problem surfaces when total return enters the picture.[ETFdb] ...

May 16, 2026 · InvestIQs Research
SCHD Dividend Growth Rate: 10-Year Trajectory — Separating Myth from Data

SCHD Dividend Growth Rate: 10-Year Trajectory — Separating Myth from Data

SCHD current price $31.72, dividend yield 3.29% — trading at 93.6% of 52-week range ($25.69–$32.13), effectively at multi-year highs1-year return +24.7% outpaces VIG +17.9%, but 5-year cumulative stands at SCHD +48.2% vs VIG +62.7% — a 14.5pp total-return gap favoring VIGDividend yield: SCHD 3.29% vs VIG 1.51% — a 2.2x spread, material for cash-flow-priority investorsP/E: SCHD 18.8 vs VIG 26.6 — lower valuation for SCHD reflects sector composition, not a quality discount10-year dividend growth fell to single digits after 2022 rate hikes — the "12% annual growth" narrative is a low-rate-era artifact Anatomy of a Dividend ETF Myth: Is SCHD the King of Dividend Growth? Monthly $30K investment 20-year compound growth simulation Required capital to generate $1,000 monthly dividend income at SCHD's current 3.29% yield Within dividend investing communities, SCHD occupies near-sacred status. Since 2020, the equation “dividend ETF = SCHD” has solidified among retail investors, supported by AUM of $91.1B, a dividend yield of 3.29%, and a 1-year return of +24.7%. [Yahoo Finance] Dissecting a full decade of quarterly dividend data, however, reveals uncomfortable terrain: growth rates are rate-cycle-dependent, and on a total-return basis, SCHD trails competing ETFs over extended horizons. The distance between myth and data warrants a quantitative examination. ...

May 16, 2026 · InvestIQs Research
SCHD Dividend Growth CAGR: Yield Decomposition Across 10 Years

SCHD Dividend Growth CAGR: Yield Decomposition Across 10 Years

SCHD current yield 3.29% at $31.8 — 94.9% of 52W range ($25.69–$32.13), not a distressed-entry scenario1Y return +27.0%; 5Y cumulative +47.1% — dividends contributed ~3.3 pts, price drove the restVIG 5Y return +61.9% outpaces SCHD by 14.8 pts — the yield premium has a total-return costSCHD P/E 18.9 vs VIG 26.8 — value tilt is real but concentrated in rate-sensitive sectorsAUM $91.1B, avg daily volume 23M shares — liquidity not a constraint at any allocation size SCHD trades at $31.8, sitting at 94.9% of its 52-week range. For yield-maximizers, that positioning matters: buying near highs compresses starting yield and extends the payback window on any drawdown. The real question is not entry timing — it is whether the dividend growth engine underneath compounds fast enough to justify that cost. ...

May 15, 2026 · InvestIQs Research