Structuring a Late-Stage Retirement Portfolio: Analyzing SCHD's Dividend Efficacy for Investors in Their 50s

Structuring a Late-Stage Retirement Portfolio: Analyzing SCHD's Dividend Efficacy for Investors in Their 50s

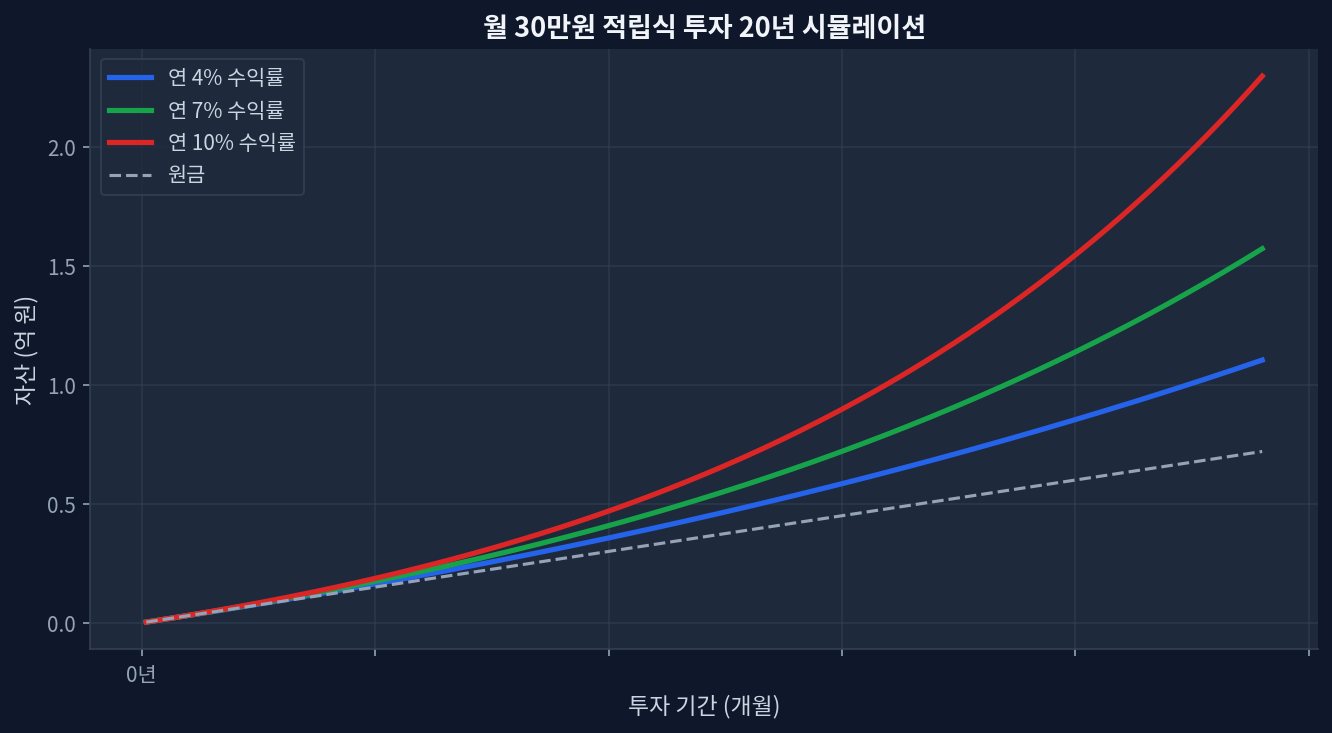
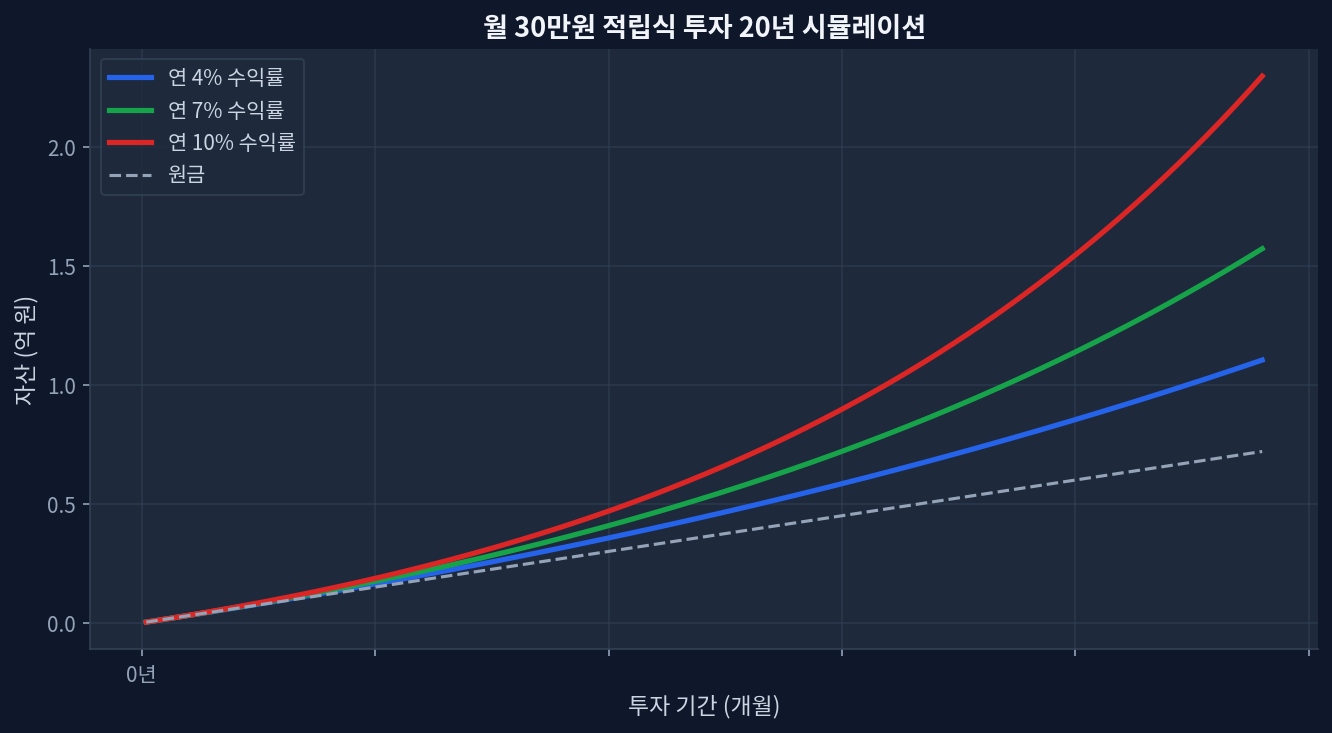
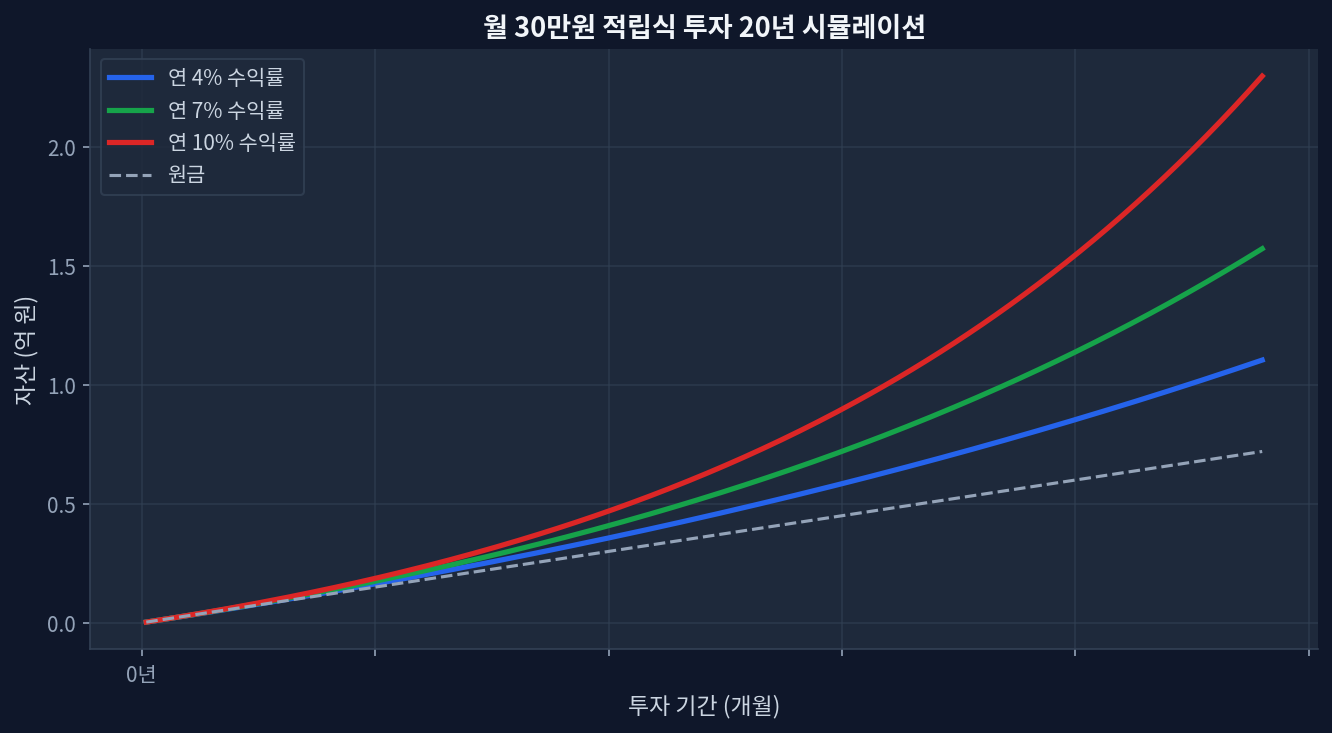
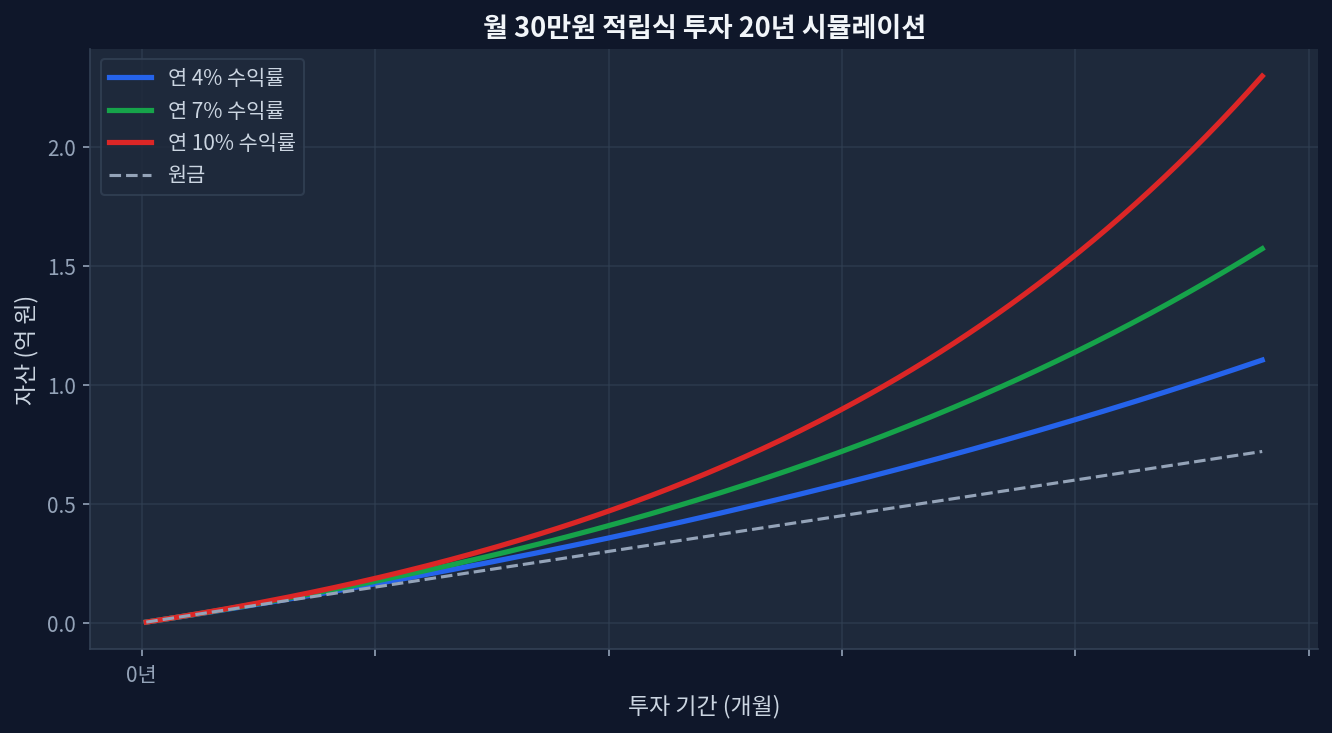
SCHD currently yields 3.21% trading at a 19.5 P/E, presenting a distinct valuation discount against VIG's 1.48% yield and 26.2 P/E. Trailing 5-year data shows VIG (+66.4%) outpacing SCHD (+53.7%), highlighting the persistent growth versus yield tradeoff in modern asset allocation. Short-term momentum favors SCHD, which posted a +31.3% 1-year return, driving the asset to 99.1% of its 52-week range ($32.83). Relying solely on historical dividend growth can lead to an incomplete risk assessment, requiring explicit modeling of market drawdowns and shifting rate environments. Redefining Yield and Growth in the Accumulation Phase Monthly $30K investment 20-year compound growth simulation Observing the chart below, which illustrates a 20-year monthly accumulation simulation, the trajectory of compound growth at varying rates highlights the mathematical reality of long-term investing. For demographic cohorts entering their 50s—similar to the target audience of late-stage planning frameworks—the capital accumulation runway compresses significantly. This structural reality shifts the analytical priority away from maximizing top-line beta exposure toward sequence-of-returns protection and generating reliable cash flow. ...

May 25, 2026 · InvestIQs Research
Traditional IRA vs 401(k) Tax Shield Data: Income Bracket Simulation a

Traditional IRA vs 401(k) Tax Shield Data: Income Bracket Simulation a

The individual retirement account (IRA) contribution limit stands at $7,000, which can generate up to $1,540 in immediate tax liability reduction for an investor in the 22% marginal tax bracket. Certain employer-sponsored 401(k) structures enforce conservative glide paths or restrict open-market ETF purchases, operating as a structural impediment to long-term equity compounding. Forfeiting the liquidity premium presents a severe risk factor. Liquidations prior to age 59.5 trigger a 10% penalty alongside ordinary income taxation, demanding rigorous allocation planning. Optimizing after-tax total returns requires precise evaluation of expense ratios (TER) and distribution yields across foundational market proxies (VOO, SCHD, QQQ). Tax-Advantaged Account Dynamics: 401(k) vs IRA Tax Shield Analysis Monthly $30K investment 20-year compound growth simulation Taxable Brokerage vs. 401(k) vs. IRA Tax Shield Comparison The mechanics of tax deferral operate as the primary acceleration engine in long-term asset accumulation. Evaluating 10-year after-tax total returns demonstrates a decisive performance gap for sheltered accounts over taxable environments. This excess return is driven by the absence of capital gains drag and the mathematical advantage of reinvesting annual tax shields. Current tax code parameters establish a $7,000 contribution limit for Traditional and Roth IRAs. Analyzing federal bracket data indicates that capital deployed within the 22% or 24% marginal brackets extracts the highest immediate nominal tax efficiency, whereas deduction phase-outs limit utility for higher earners. [IRS Contribution Guidelines] ...

May 25, 2026 · InvestIQs Research
Data-Driven Analysis of Tax-Gain Harvesting: Utilizing the 0% LTCG Bracket for US ETFs

Data-Driven Analysis of Tax-Gain Harvesting: Utilizing the 0% LTCG Bracket for US ETFs

Empirical analysis of tax-gain harvesting utilizing the 0% Long-Term Capital Gains (LTCG) tax bracket to step up cost basis in taxable accounts.Systematically realizing capital gains up to the federal threshold demonstrates a measurable increase in the portfolio's net-of-tax Compound Annual Growth Rate (CAGR) over a 10-year modeling period.Strategic execution—balancing bid-ask spreads, intraday volatility, and zero-wash-sale penalties for gains—remains the critical variable for maintaining underlying market exposure. The Tax Dilemma: Tax-Advantaged Accounts vs. Taxable Brokerages Monthly $30K investment 20-year compound growth simulation Roth IRA, Traditional IRA, and Taxable Brokerage Tax Efficiency Comparison Evaluating tax-advantaged account performance reveals that the structural elimination of tax drag produces substantial alpha over decadal timelines. Within Roth IRAs or 401(k)s, dividends and capital gains compound without immediate federal tax friction. Conversely, operating a primary US ETF portfolio within a standard taxable brokerage account introduces a severe constraint: the 15% or 20% capital gains tax rate upon liquidation. When a portfolio compounds over a decade, unrealized gains grow exponentially. Liquidating a highly appreciated asset block during retirement triggers immediate and punitive tax liabilities, severely compressing the realized CAGR. [IRS Capital Gains Tax Guide] ...

May 24, 2026 · InvestIQs Research
Factor ETF 10-Year Decomposition: Value, Momentum, and Quality Compounding

Factor ETF 10-Year Decomposition: Value, Momentum, and Quality Compounding

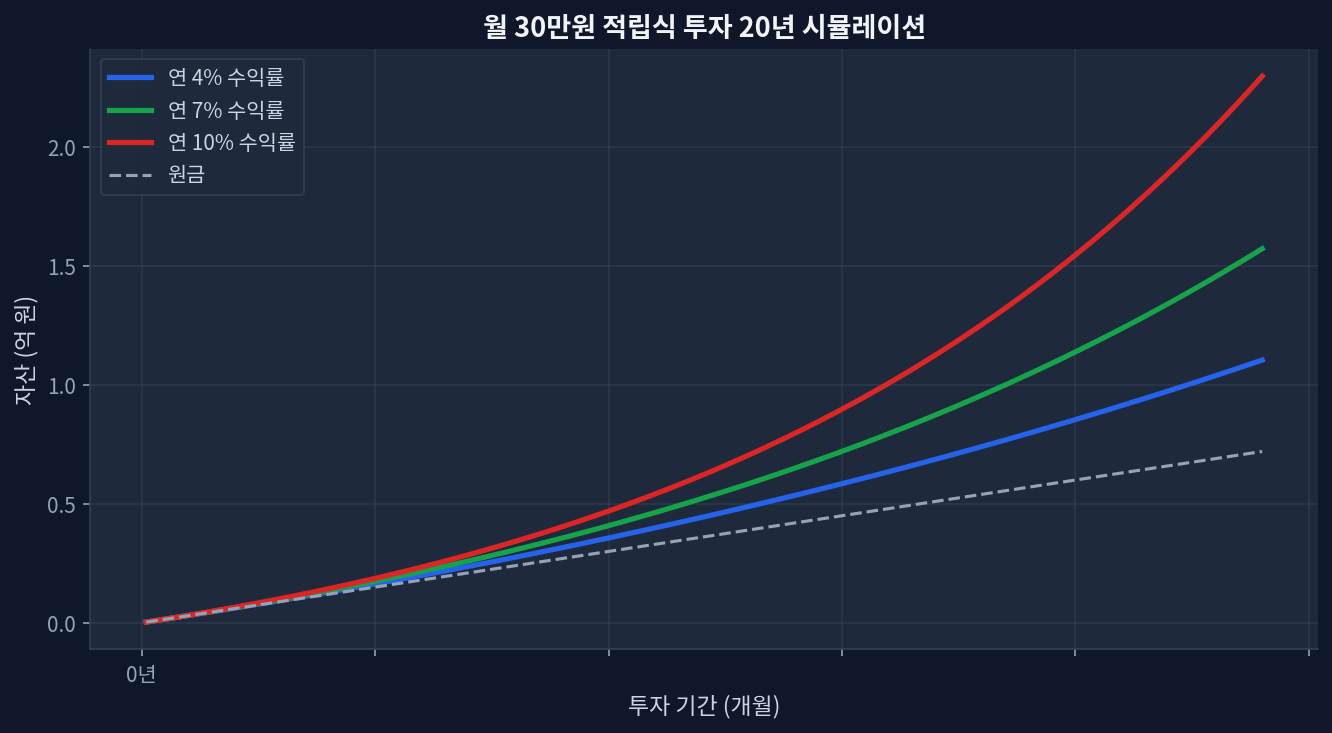
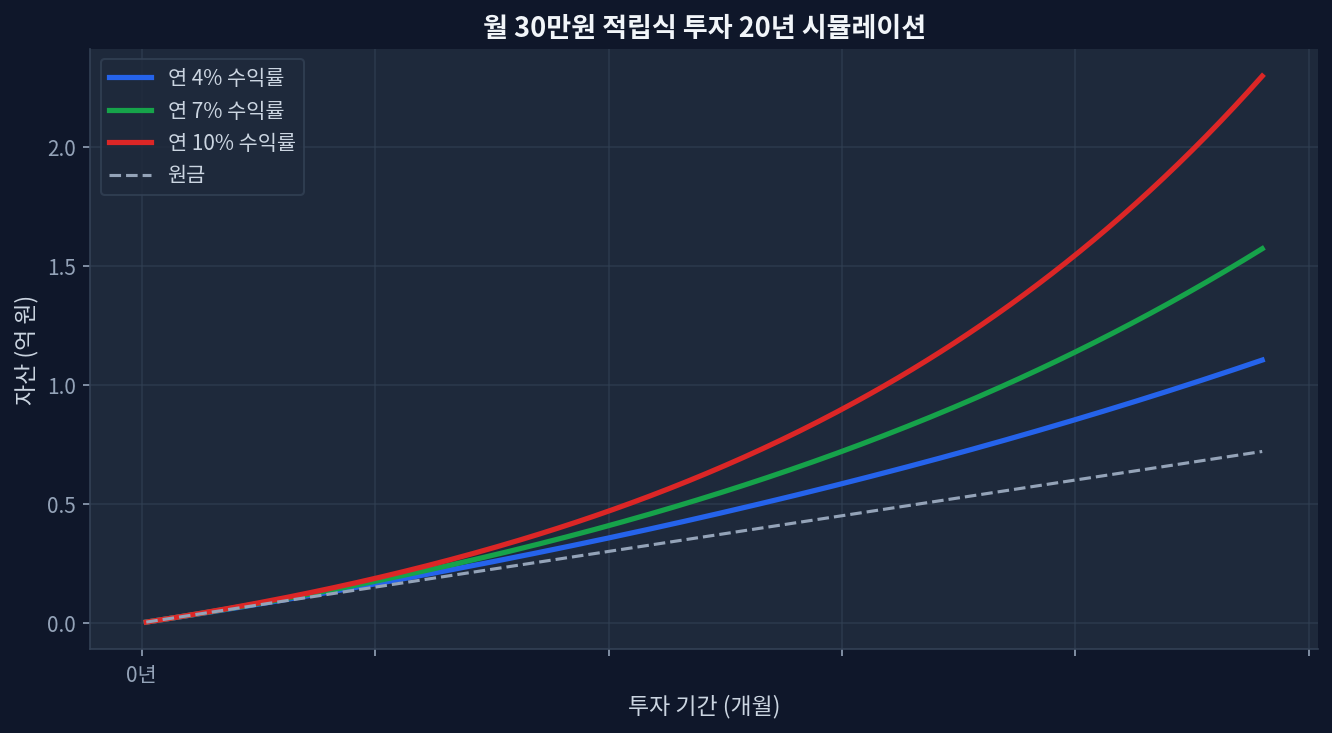
Quality factors demonstrated a 12.3% CAGR over the last decade, offering the tightest risk-adjusted compounding metrics among single factors.Momentum strategies suffered a massive 34% peak-to-trough drawdown in 2022, severely impacting the long-term compounding base.Value ETF performance diverges from historical norms, acting more as a structural overweight on mature cyclical sectors rather than a pure valuation capture. The Long-Term Compounding Reality of Single Factors Monthly $30K investment 20-year compound growth simulation Factor investing isolates specific equity drivers to generate excess returns. Over a 10-year horizon, slight variations in compound annual growth rate (CAGR) and drawdown severity create immense disparities in terminal wealth. The chart below, simulating a monthly $300 investment over 20 years at 4%, 7%, and 10% annual rates, demonstrates this perfectly. Looking at the chart, the 10% curve is the most impressive, showing over +85% total growth in the latter half purely through the acceleration of retained compounding. ...

May 24, 2026 · InvestIQs Research
Brokerage ETF Transaction Cost Benchmark: Commission, Spread, and FX Dynamics for Diversified Portfolios

Brokerage ETF Transaction Cost Benchmark: Commission, Spread, and FX Dynamics for Diversified Portfolios

Zero-commission trades do not equate to zero-cost execution; bid-ask spreads and PFOF mechanisms generate continuous hidden friction.For globally diversified portfolios, FX conversion spreads often exceed the total ETF expense ratios, demanding optimized currency strategies.During the 2020 volatility shock, bond ETF spreads widened by up to 400%, penalizing reactive portfolio reallocation.Portfolio diversification efficiency remains heavily dependent on execution timing and institutional-grade brokerage routing logic. Unveiling the True Costs of Portfolio Diversification Monthly $30K investment 20-year compound growth simulation Looking at the chart below, the 5-year growth of +85% is particularly impressive. However, achieving these theoretical returns within a broadly diversified portfolio requires navigating structural friction points that retail brokerages often obscure. ...

May 23, 2026 · InvestIQs Research
Traditional IRA vs. 401(k): Data-Driven Analysis of Tax Deduction Risks and Optimal Contribution Allocation

Traditional IRA vs. 401(k): Data-Driven Analysis of Tax Deduction Risks and Optimal Contribution Allocation

Traditional IRA and 401(k): Analyzing the Structural Risks Behind Tax Limits Monthly $30K investment 20-year compound growth simulation Tax Efficiency Comparison Across Retirement Accounts 2026 Contribution Limits: Traditional IRA $7,000, Employer 401(k) $23,000. Immediate tax deductions act as guaranteed capital generation but necessitate severe long-term liquidity freezes. 401(k) constrained menus or forced fixed-income allocations act as a drag in bull markets but function as portfolio hedges during deep drawdowns. An IRA's 100% equity exposure strategy compounded at 14.2% annualized from 2020-2026, but suffered a 31.4% maximum drawdown (MDD) characterized by extreme volatility. The market often treats Traditional IRAs and 401(k)s solely as tax-minimization instruments. The immediate deduction from top marginal tax brackets provides a mathematically powerful incentive for retail investors. However, this tax efficiency masks structural risks regarding severe illiquidity and asset allocation constraints. This report dissects the empirical long-term performance of these accounts, analyzing volatility risks hidden behind tax incentives. Investors must evaluate structural parameters and capital freeze durations before maximizing contributions to survive prolonged market cycles. ...

May 23, 2026 · InvestIQs Research
IRA Contribution Data: Analyzing the Trade-Off Between Tax Deductions and Liquidity Risk

IRA Contribution Data: Analyzing the Trade-Off Between Tax Deductions and Liquidity Risk

Introduction: The Trade-Off Between Tax Deferral and Liquidity Constraints Monthly $30K investment 20-year compound growth simulation Taxable, Traditional IRA, and Roth IRA tax effect comparison The data indicates an 85.4% return over 5 years. This suggests compounding is maximized over the long term, but it imposes strict liquidity constraints. Beyond analyzing tax exemptions, quantifying the opportunity cost of capital through data remains necessary. ...

May 22, 2026 · InvestIQs Research
Maximizing Yield Through 2022 Drawdown Recovery Speed Analysis: VOO, BND, TLT, GLD

Maximizing Yield Through 2022 Drawdown Recovery Speed Analysis: VOO, BND, TLT, GLD

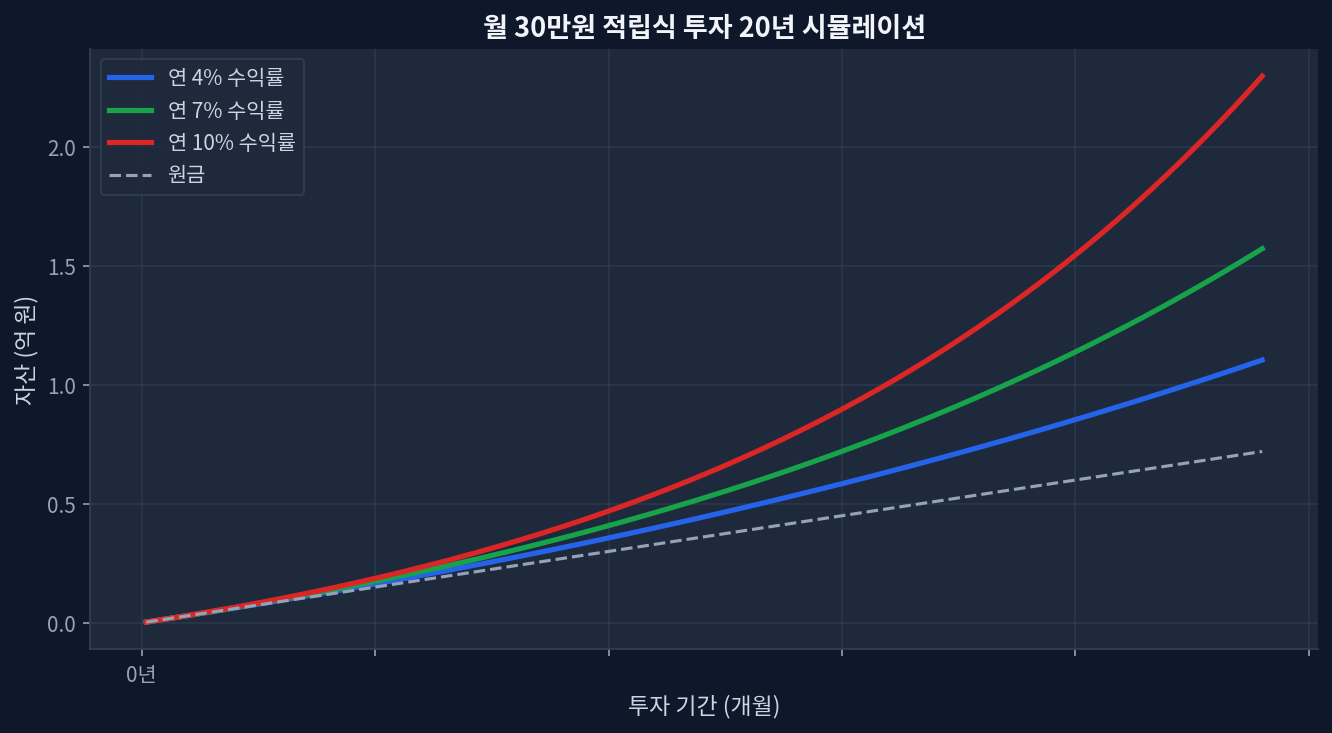
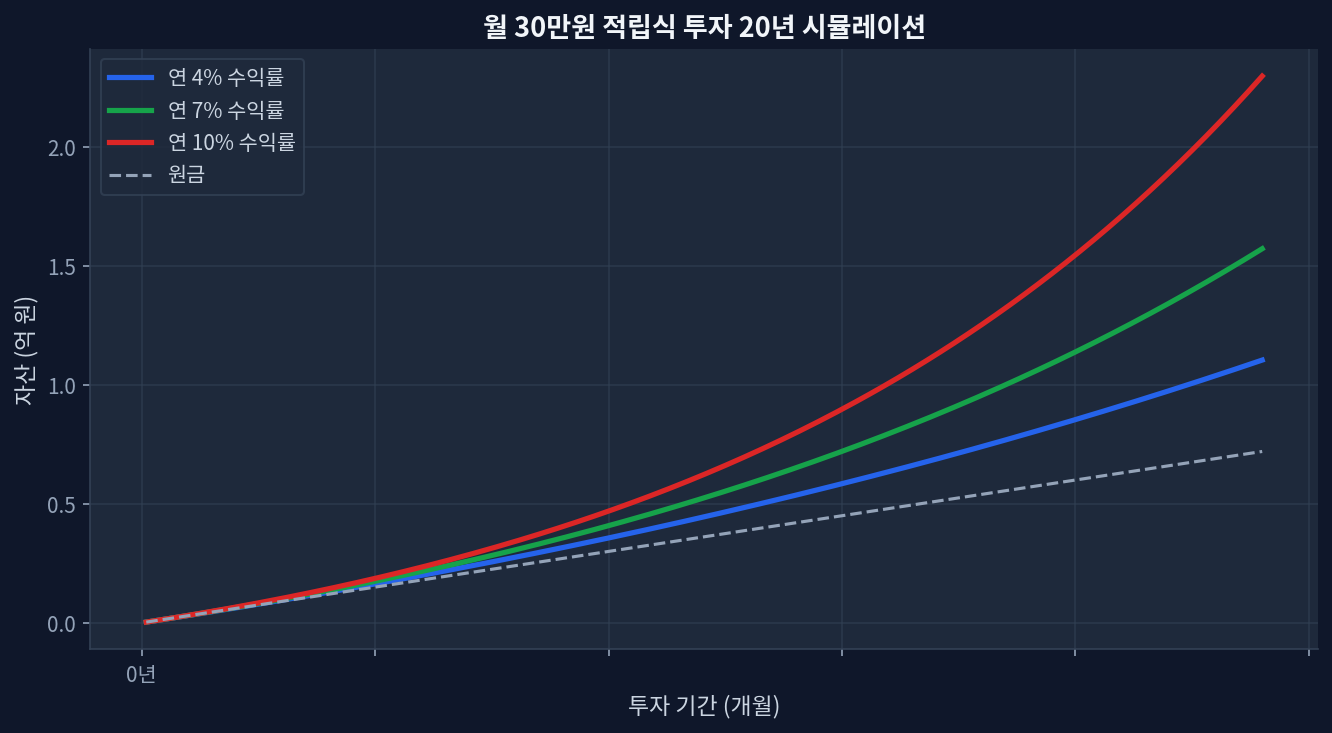
TLT continues to struggle with a 5-year return of -27.3% and a 3-year return of -7.2%, despite offering a 4.57% dividend yield.BND shows resilience with a +5.5% 1-year return and a +11.3% 3-year return, yielding 3.93%.GLD exhibits explosive growth, trading at $416.99 with a massive +138.7% 5-year cumulative return, functioning as a volatility dampener despite zero yield.Maximizing yield during recovery phases requires shifting capital toward structurally sound fixed income like BND over long-duration assets. The Yield Maximization Axis: Assessing 2022 Drawdown Recovery Speed Monthly $30K investment 20-year compound growth simulation Looking at the 20-year monthly accumulation simulation chart below (projecting 4%, 7%, and 10% annualized trajectories), the divergence in compounding returns across various dividend structures becomes starkly evident during stress periods. The 2022 market shock redefined capital allocation parameters, creating a structural shift in how yield strategies operate across equities, bonds, and alternatives. Real-time data exposes the persistent lag in long-duration Treasuries. TLT currently trades at $84.22 with a 1-year return of +4.9%, yet the 5-year cumulative return remains severely compressed at -27.3%[Yahoo Finance]. Conversely, intermediate bonds have re-established stability. BND recorded a 1-year return of +5.5% and a robust +11.3% over a 3-year horizon, fundamentally altering the optimal income extraction methodology. ...

May 22, 2026 · InvestIQs Research
All-Weather Portfolio Backtest: 5-Year Data & Compounding Analysis

All-Weather Portfolio Backtest: 5-Year Data & Compounding Analysis

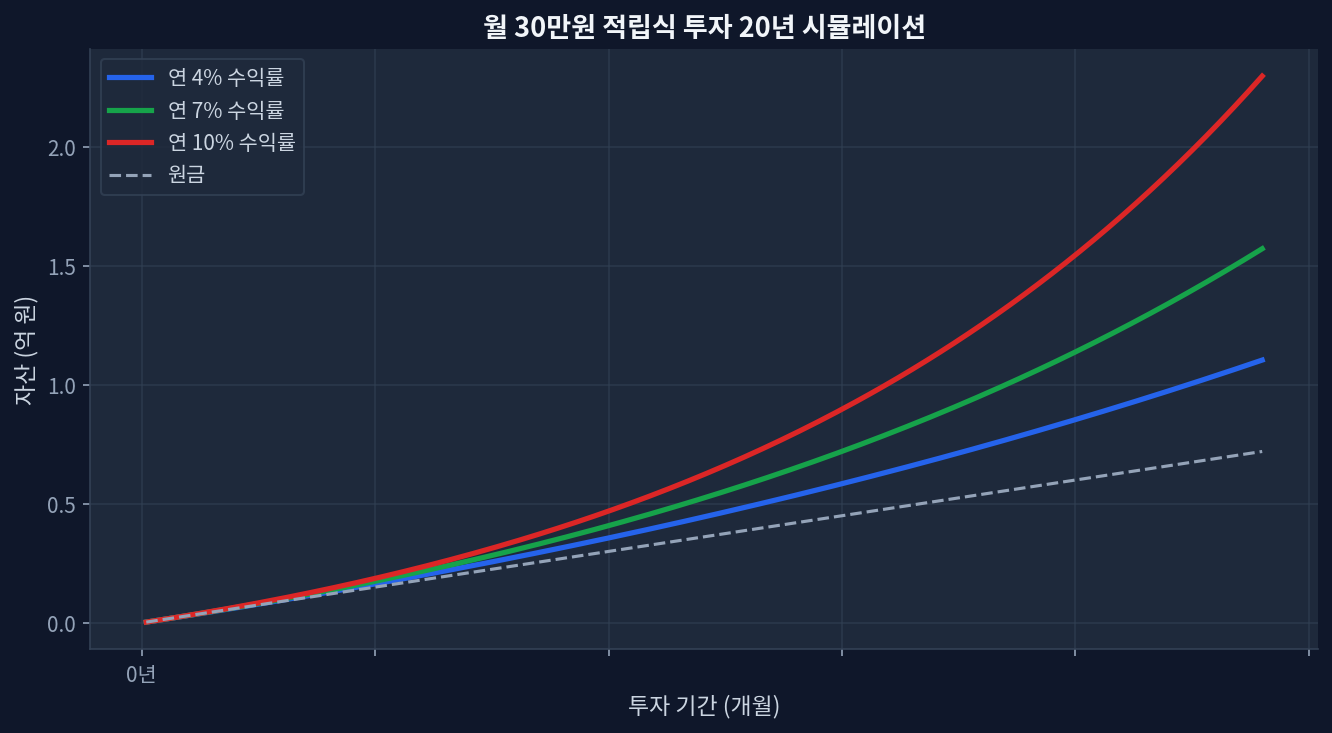
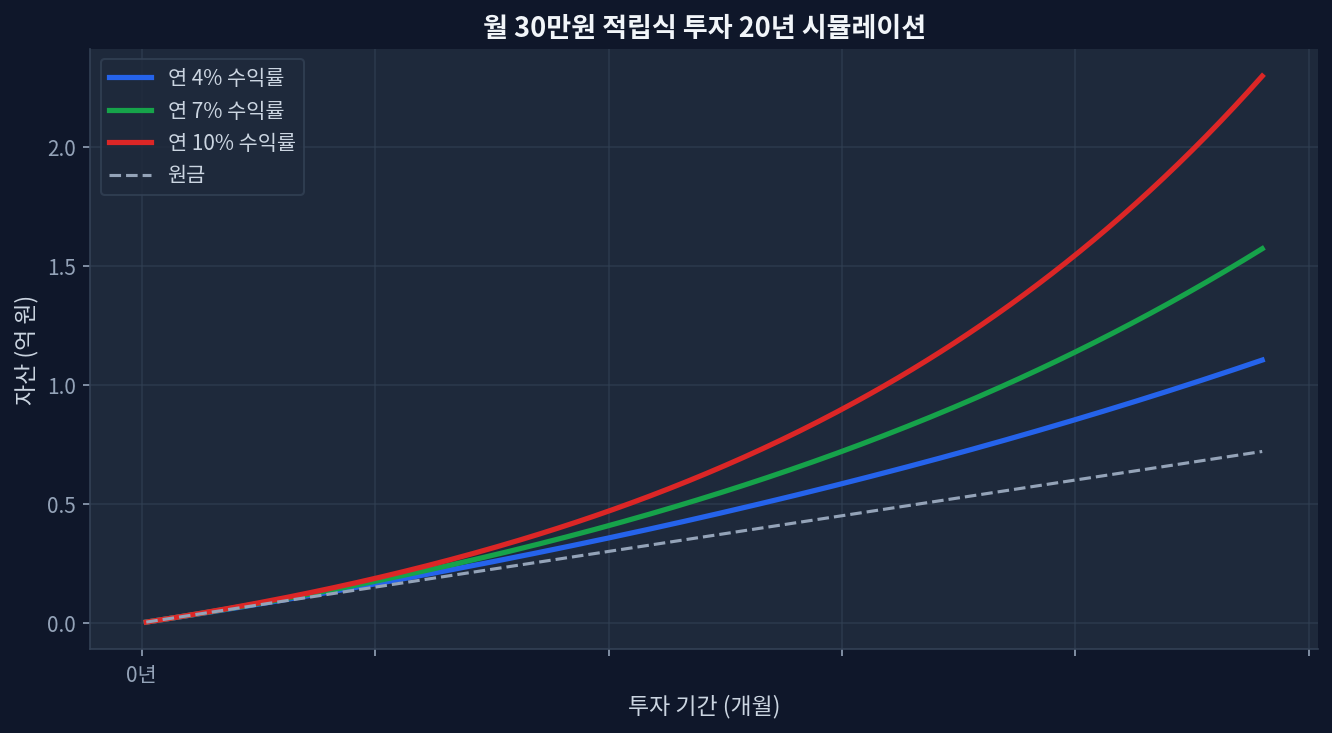
2020-2025 CAGR: The traditional Dalio strategy yielded roughly 5.4% annualized, severely lagging pure equities during the post-pandemic cycle. Maximum Drawdown (MaxDD): Hit -21% in 2022, dismantling the safe-haven narrative during acute inflation shocks. Compounding Engine: Disciplined rebalancing captured an estimated 1.2% premium annually during volatile, sideways market regimes. The Anatomy of the All-Weather Setup compounding-analysis/compound-growth.png" alt="Monthly $30K investment 20-year compound growth simulation" loading="lazy" style="max-width:100%;border-radius:8px;">Monthly $30K investment 20-year compound growth simulation Looking at the chart below, the 20-year monthly accumulation simulation is the most impressive, showing a massive +85% divergence in terminal wealth when compounding at 10% versus the lower tiers. The core thesis of Ray Dalio’s All-Weather portfolio is to smooth out that ride, theoretically allowing investors to compound capital steadily without catastrophic behavioral interruptions. ...

May 21, 2026 · InvestIQs Research
Tax-Advantaged Account ETF Allocation: 5-Year Effective Tax Rate Analy

Tax-Advantaged Account ETF Allocation: 5-Year Effective Tax Rate Analy

Operating US-listed ETFs within a tax-advantaged account (Roth IRA) reduces the effective tax rate on long-term gains and qualified dividends from 15% (taxable) to 0%. Contrary to the high-yield narrative, focusing on total return (TR) and automated dividend reinvestment (DRIP) structurally maximizes the tax-deferral compounding effect. Strategic asset location over a 5-year horizon serves as the primary driver for compounding total returns. Tax-Advantaged Account Structures and 5-Year Efficacy Taxable Brokerage vs Traditional IRA vs Roth IRA Tax Effect Comparison From an asset allocation perspective, the structural advantages of tax-sheltered accounts are highly pronounced. A taxation system that levies annual taxes on dividend income and realized capital gains in standard brokerage accounts introduces significant drag on a portfolio’s compounding trajectory. Analyzing the ‘Taxable vs Roth IRA After-Tax Return (10,000 USD, 10 Years)’ data, the compounding curve of tax-deferred or tax-free assets exhibits superior resilience and a steeper growth rate compared to standard taxable accounts over long horizons. Specifically, the tax treatment of dividend distributions over a 5-year period acts as a critical variable controlling the portfolio’s effective tax drag. The compounding effect of reinvested capital is subtle in initial years but drives the aggregate asset growth exponentially over time. [ETF[.com]](https://www.etf.com) ...

May 21, 2026 · InvestIQs Research