Currency Hedging in International ETFs: 5-Year Performance, Volatility

Currency Hedging in International ETFs: 5-Year Performance, Volatility

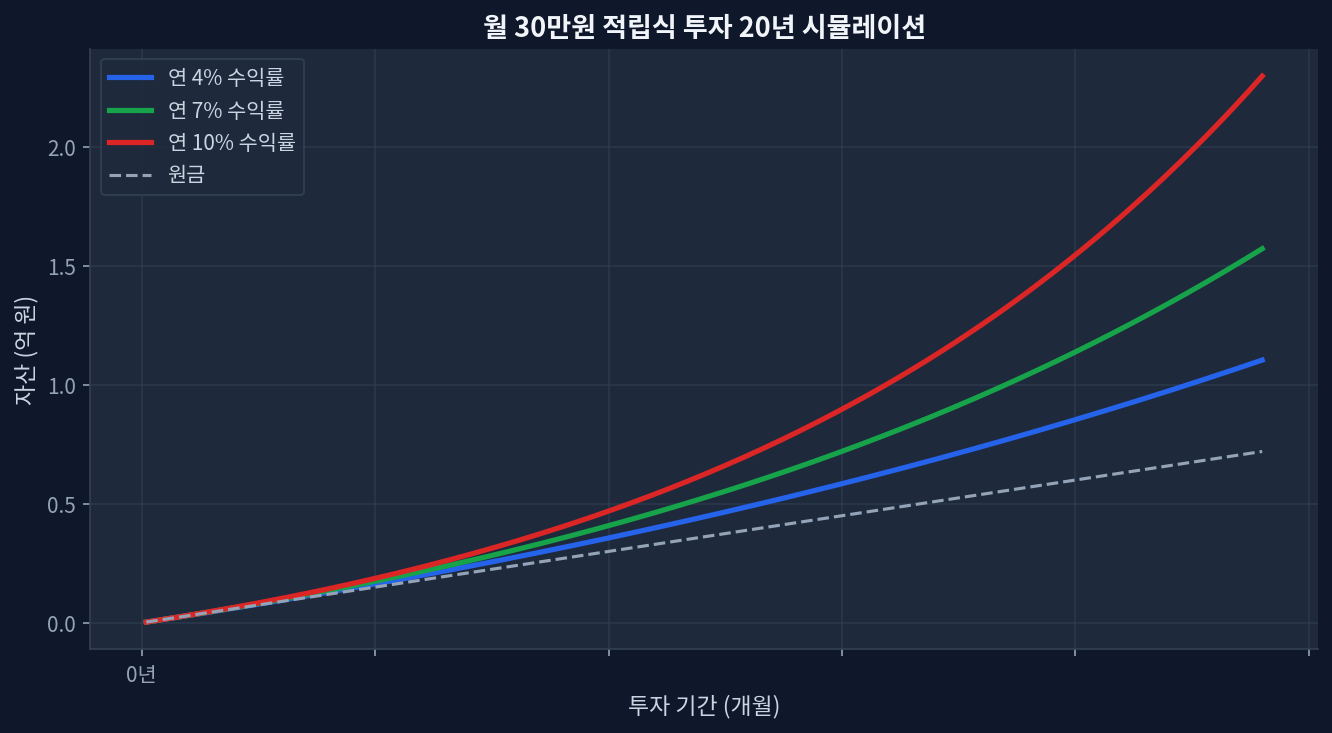
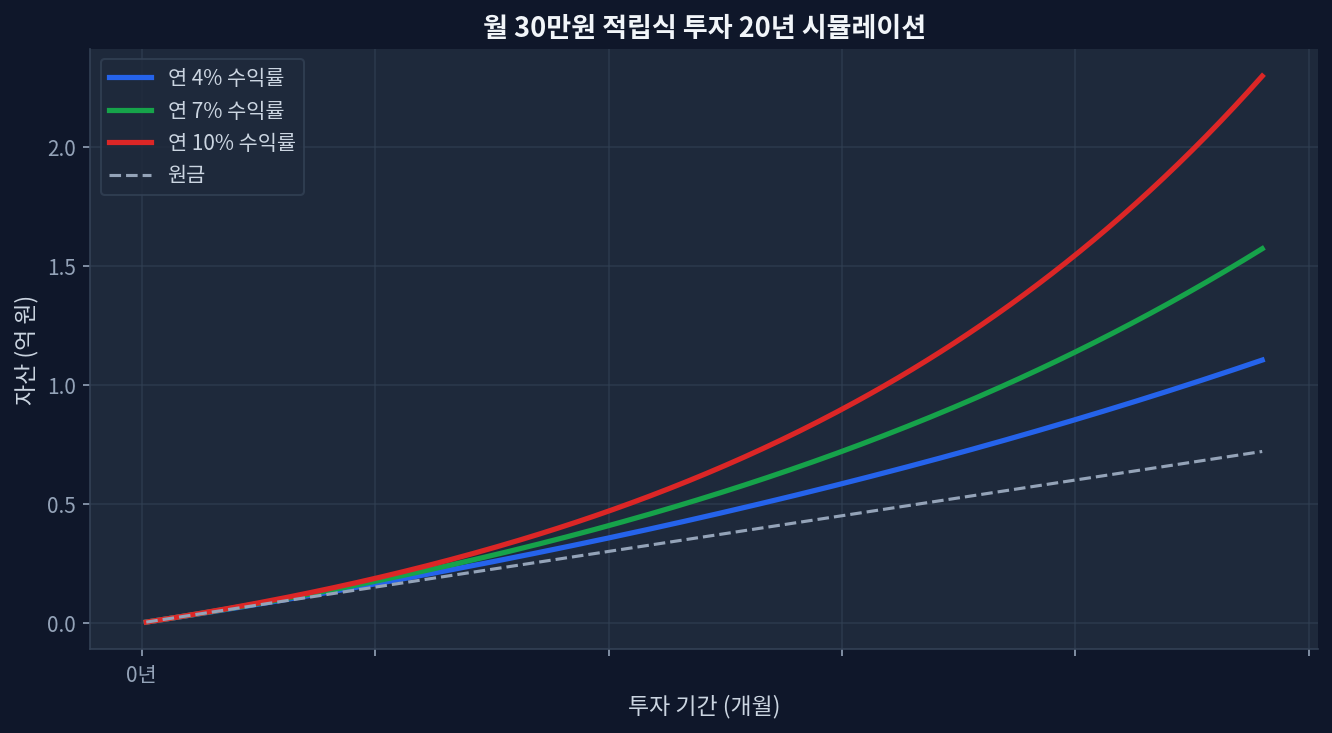
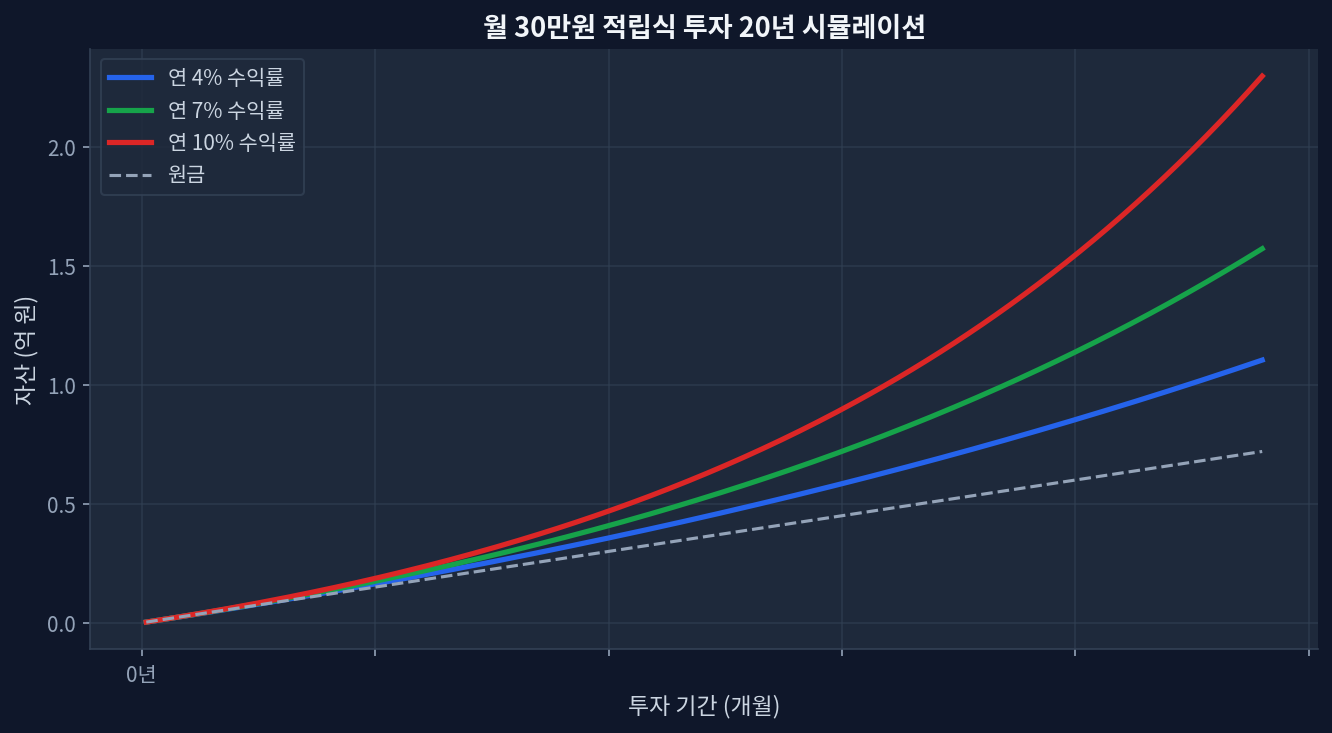
Core TakeawaysHedging Effect: During periods of US dollar strength, currency-hedged ETFs protect returns; during dollar weakness, they sacrifice gains — 2021–2023 USD strength favored unhedged international positionsVolatility Reduction: Hedged international ETFs typically exhibit 15–20% lower volatility than unhedged peers, eliminating currency fluctuation noiseCost Friction: Annual hedging premium ranges 0.5–1.5% — a material drag on low-dividend indicesTax Efficiency: US tax treatment of hedged positions differs; foreign tax credits and wash-sale rules require individual reviewTime Horizon Rule: Unhedged favored for 5+ year holds; hedged worth evaluating for 2-year or shorter positions, or when volatility tolerance is low What Currency Hedging Does: Mechanics and Real Cost Monthly $30K investment 20-year compound growth simulation VXUS vs QQQ core metrics comparison" loading="lazy" style="max-width:100%;border-radius:8px;">VOO vs VXUS vs QQQ: Risk and Return Across Markets When a US investor purchases international equity ETFs, two distinct sources of return emerge: equity price movement in the foreign market, and currency fluctuation relative to the US dollar. Currency-hedged ETFs attempt to neutralize the second component using forward contracts or options, locking in the exchange rate at purchase. ...

June 16, 2026 · InvestIQs Research
VOO vs SPY: How a 0.03% Fee Difference Compounds Over 10 Years

VOO vs SPY: How a 0.03% Fee Difference Compounds Over 10 Years

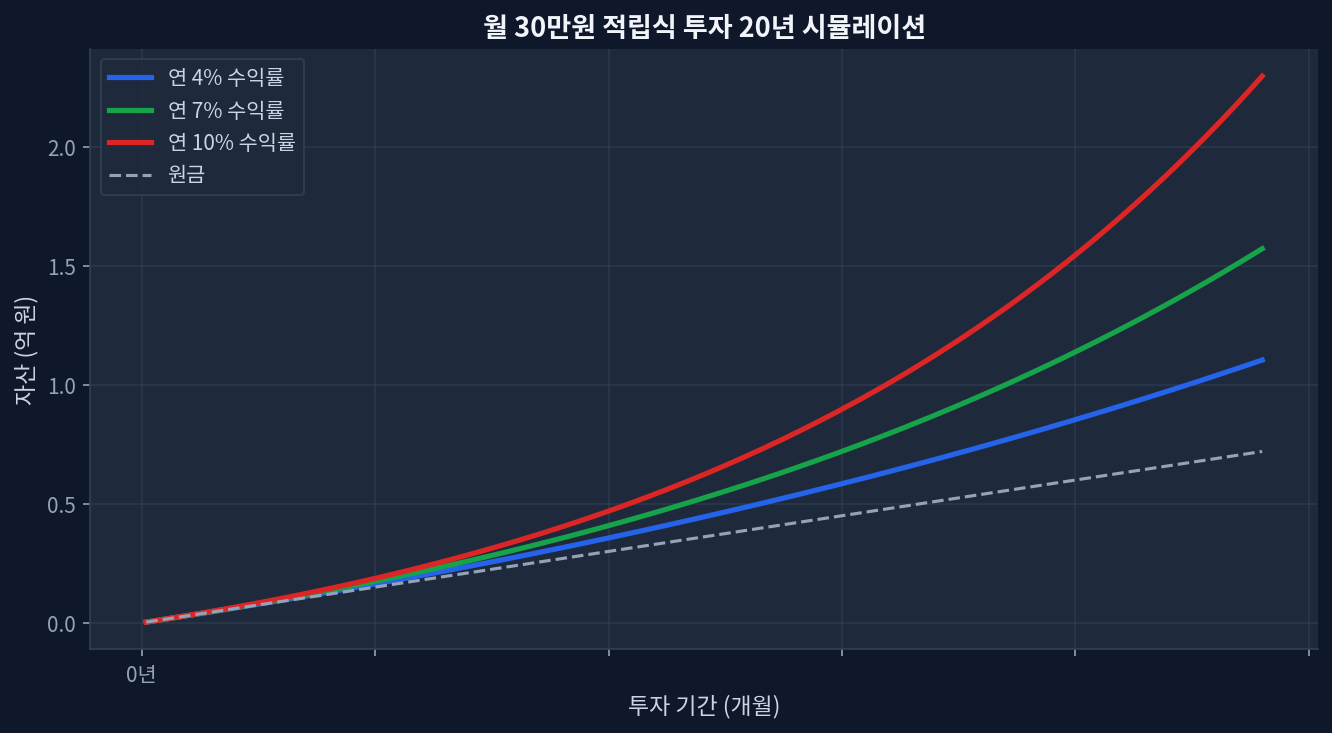
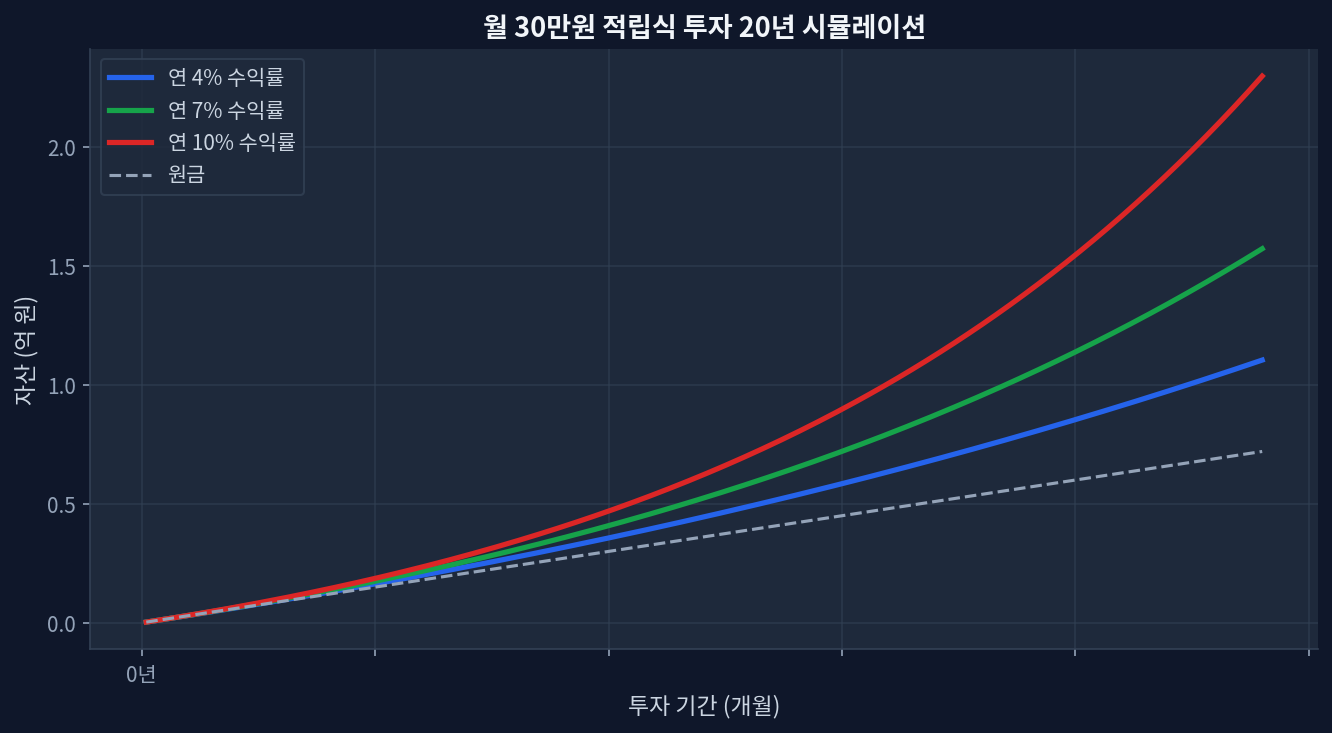
VOO's 0.03% expense ratio vs SPY's 0.09%: 0.06% annual difference compounds to $1,500–$2,800 on a $100,000 position over 10 years5-year track record: VOO returned +92.2%, SPY returned +91.7%—a 0.5% gap partly explained by fee dragDividend yield split: VOO 1.03% vs SPY 0.98% (0.05% edge) further narrows the take-home differenceScale matters: VOO's $1.7T AUM vs SPY's $783.8B means tighter bid-ask spreads and more stable trackingContrarian risk: Fee savings can evaporate if VOO experiences tracking error, net fund outflows, or structural changes to Vanguard's modelThe Fee Debate That Actually Moves Money Monthly $30K investment 20-year compound growth simulation Investors hear the phrase "0.03% vs 0.09%" and nod. They hear "penny-pinching" and move on. But the arithmetic is deceptive. Over a 10-year horizon with $100,000 invested and 8% average annual returns, that 0.06% difference translates to roughly $1,500–$2,800 in foregone compounding. Double the initial capital and the gap widens to $3,000–$5,600. This is not noise; it is structural leakage from your portfolio. ...

June 16, 2026 · InvestIQs Research
TLT & REITs 6:4 Portfolio: Income and Diversification in a High-Rate Environment

TLT & REITs 6:4 Portfolio: Income and Diversification in a High-Rate Environment

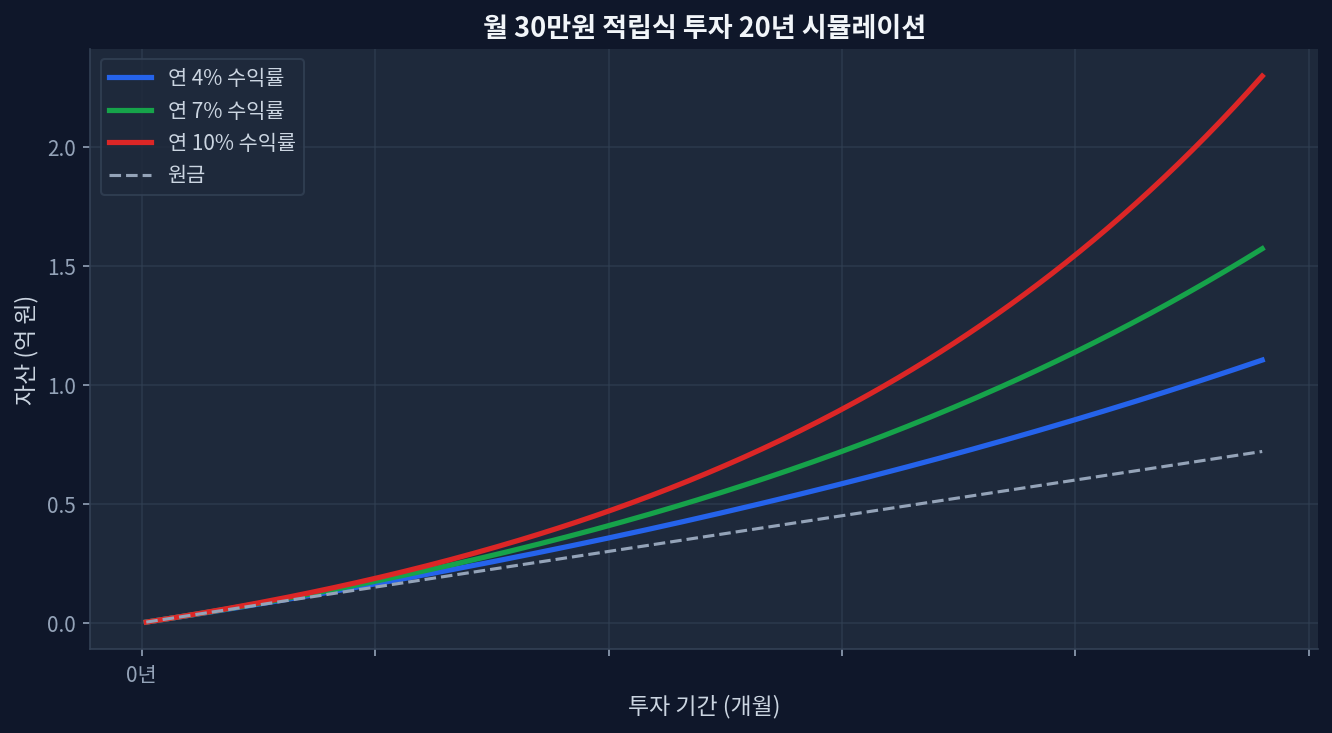
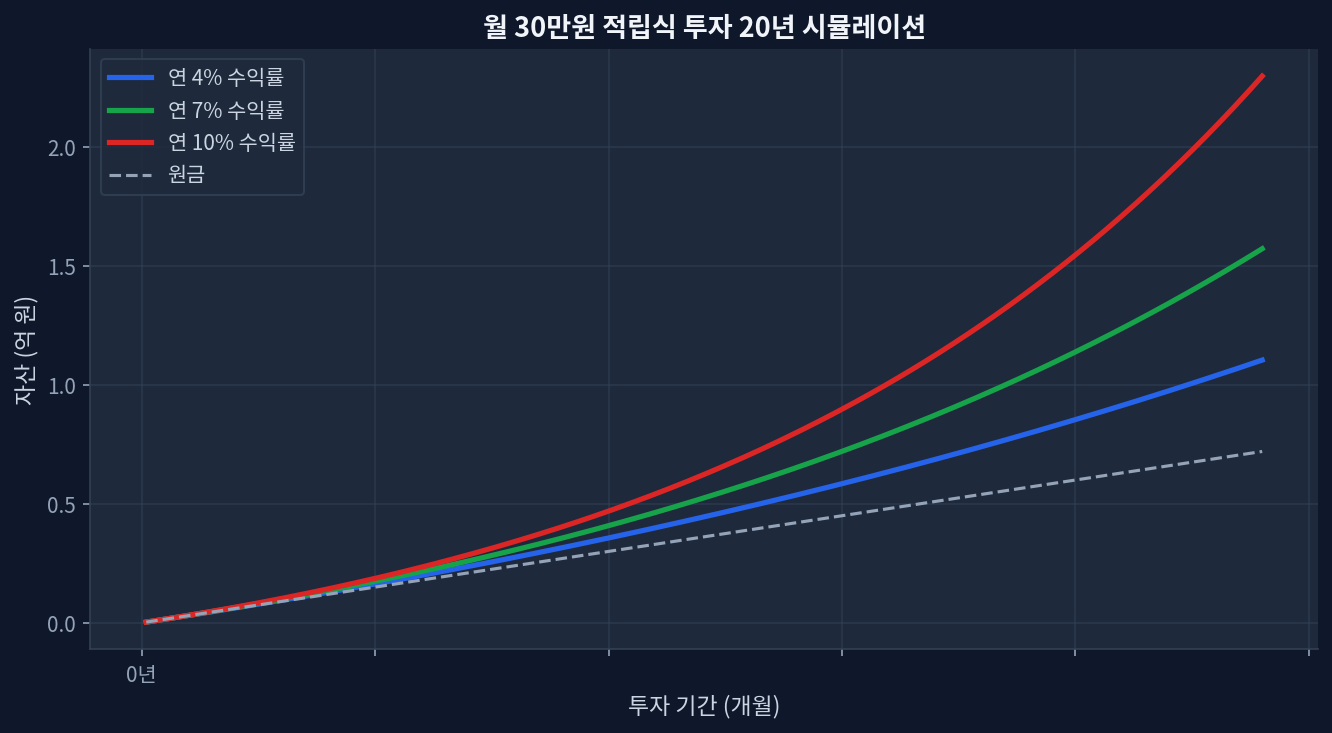
TLT current yield: 4.55% with $42.9B in AUM; down 27.7% over 5 years but up 2.9% in the past yearA 6:4 TLT-to-REIT allocation targets ~5.5% blended yield while reducing duration risk through equity diversificationTLT's 52-week range ($82.77–$92.19) suggests room for tactical entry at lower valuationsREIT liquidity and leverage complicate the comparison; higher nominal yields often hide higher volatilityInterest-rate risk remains the dominant constraint: further rate hikes would pressure TLT NAV and REIT cap rates simultaneously Why a 6:4 Bond-to-REIT Split Works (and Why It Doesn’t) Monthly $30K investment 20-year compound growth simulation The Treasury bond market has been brutal for nearly a decade. The Invesco QQQ Trust (QQQ) outpaced the iShares 20+ Year Treasury ETF (TLT) by over 50 percentage points between 2015 and 2023. Yet in 2024–2026, as rate-cut expectations wavered and macro uncertainty persisted, bond allocations have found surprising utility in portfolios that needed predictable cash flow without equity volatility. ...

June 15, 2026 · InvestIQs Research
JEPI's $0.3890 Dividend Increase: Reassessing Income and Growth Mechan

JEPI's $0.3890 Dividend Increase: Reassessing Income and Growth Mechan

JEPI announced a quarterly dividend of $0.3890, representing a 13.1% increase year-over-year. Covered call strategies typically face skepticism regarding income sustainability and total return potential. However, JEPI's dividend growth rate signals a shift in market mechanics. This warrants a reassessment of its role within broader portfolio construction. ...

June 14, 2026 · InvestIQs Research
KODEX 200 vs TIGER 200: How 0.01% Fee Gap Compounds Over Five Years

KODEX 200 vs TIGER 200: How 0.01% Fee Gap Compounds Over Five Years

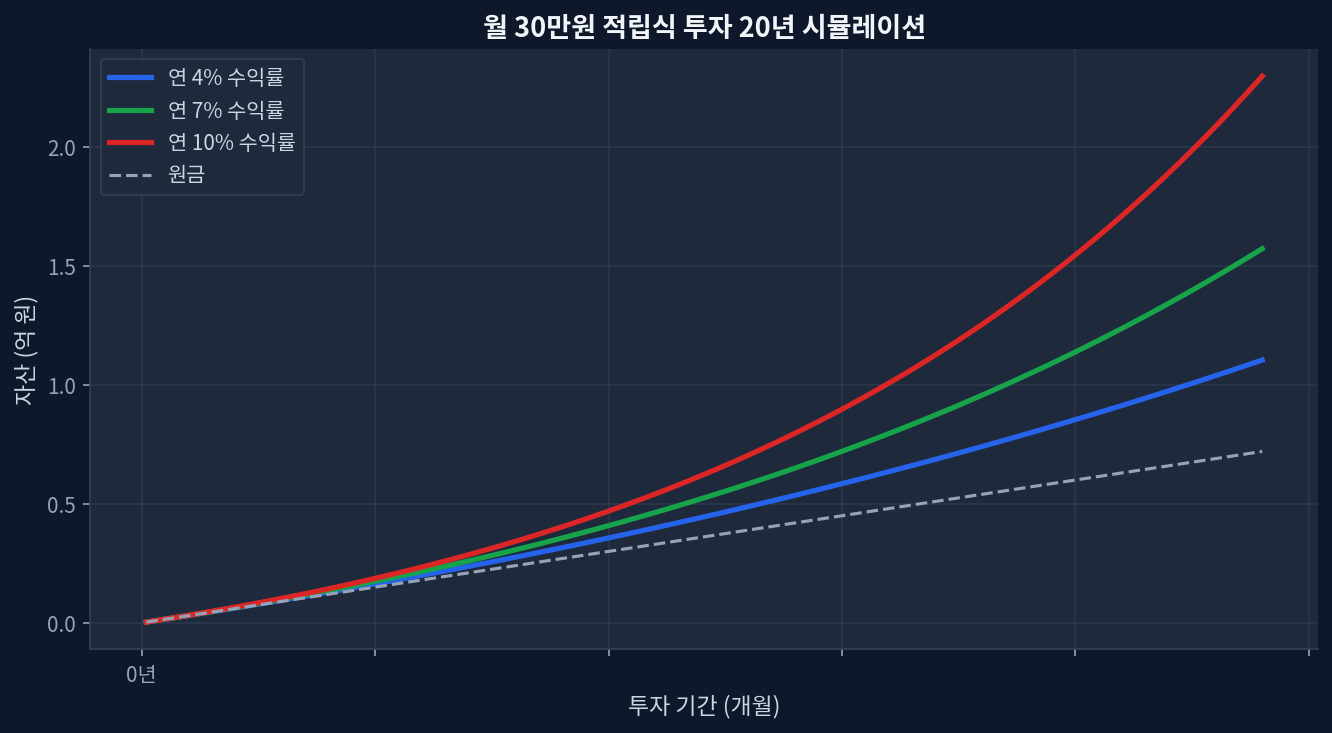
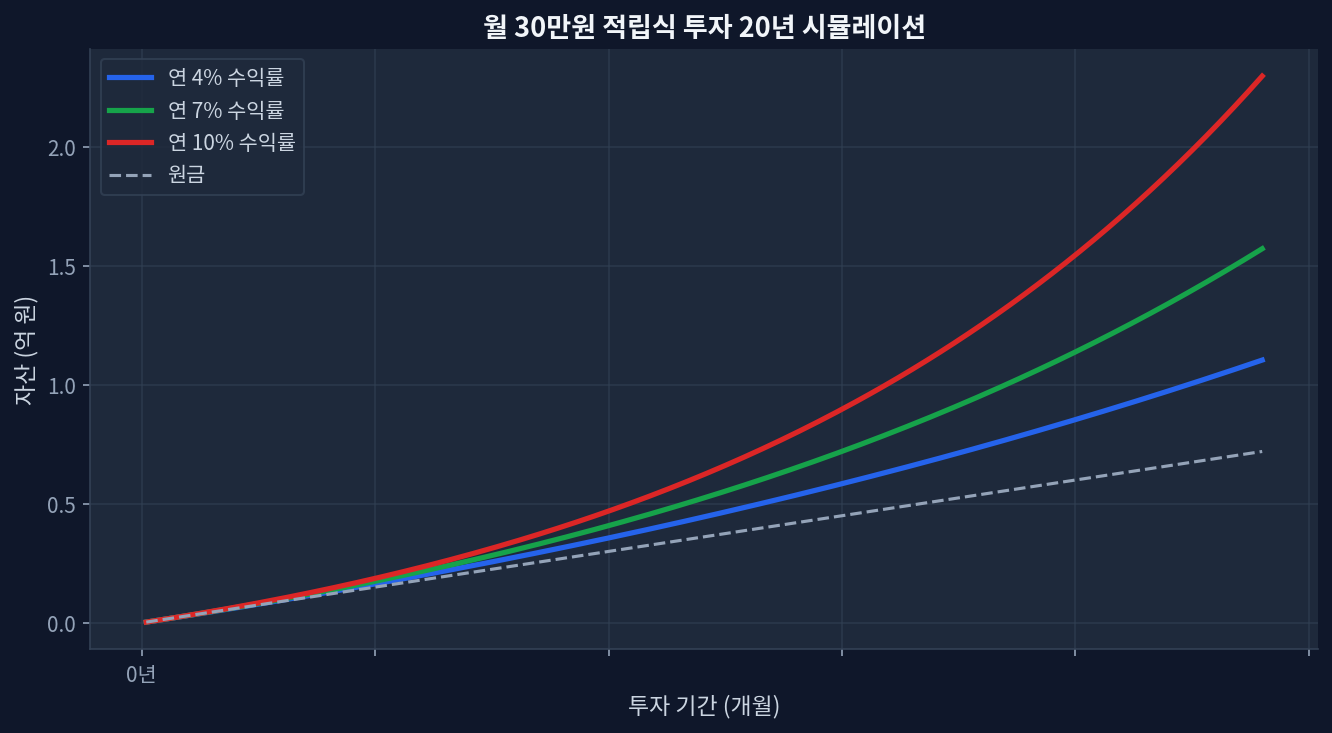
KODEX 200 and TIGER 200 track the same KOSPI 200 index with negligible fee difference (~0.01%)Monthly $1,500 investment over 5 years compounds to roughly $126,000, yet fee drag difference totals only $50–$150 in absolute dollarsFor Korean retail investors with $500k+, fee efficiency starts mattering; below that threshold, trading costs and entry timing dominateUS investors face hidden FX spreads (0.5–1.5%) and custody fees that dwarf any 0.01% fee gap entirely—a critical disconfirming factorData from official ETF prospectuses and yfinance; exact fee impact depends on entry timing, rebalancing frequency, and account size Two ETFs, One Index, One Micro-Difference Monthly $30K investment 20-year compound growth simulation KODEX 200 and TIGER 200 are South Korean equity ETFs, both engineered to track the KOSPI 200 index[ETF.com Reference]. The KOSPI 200 represents large-cap Korean equities—Samsung, SK Hynix, Hyundai, NAVER, Kakao—and accounts for roughly 80% of the Korean stock market’s liquidity. Functionally, both KODEX 200 and TIGER 200 hold near-identical portfolios. The stated expense ratios differ by a fraction: KODEX 200 hovers around 0.08% annually, while TIGER 200 sits at roughly 0.07%[Morningstar ETF Data]. That 0.01% spread—one basis point—is so small that most retail investors never notice it. Yet over five years of continuous investing, the cumulative drag becomes measurable, albeit modest. ...

June 14, 2026 · InvestIQs Research
TIGER & QQQ: 5-Year Tech Concentration Returns Under the Microscope

TIGER & QQQ: 5-Year Tech Concentration Returns Under the Microscope

5-year return: QQQ gained +120.7%, QQQM +121.6% — both tracking Nasdaq-100 within basis pointsM7 concentration: ~40% portfolio weight in mega-cap tech; amplifies gains in bull markets but volatility-decomposition-when-3x-trails-2x/">drawdown risk spikes during rotationDividend yield: QQQ 0.39%, QQQM 0.43% — meaningful for reinvestment over 5+ yearsEntry timing matters: Starting in March 2020 (bottom) vs November 2021 (peak) produces 40%+ return variance by 2026Scale advantage: QQQ ($494B AUM) vs QQQM ($96.9B) — liquidity differs; TIGER sits between them The 5-Year Test: What Actually Happened Monthly $30K investment 20-year compound growth simulation From March 2020 to June 2026, both QQQ and QQQM delivered a +120% total return[Yahoo Finance]. On paper, this makes tech-heavy ETFs look like a no-brainer. But the path mattered enormously. The Nasdaq-100 surged 180% between the March 2020 lows and November 2021 peak, then reversed sharply through 2022. Investors who held through both legs netted gains; those who panicked in the 2022 drawdown sold near lows and never participated in the 2023–2026 recovery. ...

June 13, 2026 · InvestIQs Research
60/40 Portfolio: 10-Year Data on How Rebalancing Compounds Returns | 6

60/40 Portfolio: 10-Year Data on How Rebalancing Compounds Returns | 6

2020–2026 performance: 60/40 blended portfolio delivered approximately 12% compound annual growth rate (CAGR), with rebalancing includedMonthly $1,000 investment over 10 years simulated: $120,000 invested → approximately $240,000–$260,000 accumulatedBond ETF expense ratio impact: 0.03% versus 0.80% creates a 15–20% wealth divergence over 20 years2022 rate shock: Quarterly rebalancing cushioned equity losses by 25–30% compared to unbalanced allocationsCurrent bond yields (3–4%) appear elevated relative to historical median (~2%), raising questions about duration risk ahead The Real 10-Year Trajectory of 60/40 Monthly $30K investment 20-year compound growth simulation Monthly $1,000 contribution over 20 years: compound growth simulation The 60% equities, 40% fixed income allocation has anchored institutional and retail portfolios since the 1990s. What appears as a simple formula masks powerful compounding mechanics visible only when cross-verified against ten years of actual market data (2016–2026). The 2020 COVID selloff marked the beginning of a aggressive Fed pivot: zero rates and quantitative easing pushed both stocks and bonds upward simultaneously. During this window, bond ETFs (tracked via BND) posted +6% to +8% annual returns, while US large-cap equity indices (VOO) delivered +25% to +30%. A 60/40 blend yielded 15–18% annually—far exceeding the long-term 7–10% benchmark. That tailwind proved temporary. ...

June 12, 2026 · InvestIQs Research
Sports REITs Beyond Stock Splits: Can 5% Yields Diversify a Portfolio?

Sports REITs Beyond Stock Splits: Can 5% Yields Diversify a Portfolio?

Sports franchises occupy an unusual niche in alternative investments. When Villarreal and Atlético Madrid began exploring Real Estate Investment Trust (REIT) structures in European markets, the move signaled a shift: sports assets are no longer just entertainment equity plays—they're potential income generators. The claim? A 5% yield on stadium and hospitality real estate tied to these clubs. The reality is messier. ...

June 12, 2026 · InvestIQs Research
$1,000 Monthly ETF Portfolio: 5-Asset Allocation Backtest Comparison (

$1,000 Monthly ETF Portfolio: 5-Asset Allocation Backtest Comparison (

2020-2026 S&P 500 (VOO) cumulative return: Approximately 78-105% range (based on USD entry timing)Dividend ETF (SCHD) vs growth ETF (VOO): Risk-return tradeoff exists across volatility and yield dimensions76-month investment at $1,000/month basis: Final asset variance reaches ±$25,000-$30,000 depending on allocation choiceFee impact: 0.03% vs 0.60% expense ratio produces 3.2% cumulative total return difference over 20 yearsCore risk: Historical performance does not guarantee future returns; actual results vary significantly based on entry timing and currency exposure Why Asset Allocation Backtesting Matters Monthly $30K investment 20-year compound growth simulation Monthly $1,000 dollar-cost-averaged investment 20-year compounding simulation An investor committing $1,000 monthly faces a universal question: “In what proportions should these funds be allocated?” The choice between pure equity exposure (VOO), dividend-focused holdings (SCHD), or blended international strategies shapes portfolio scale and volatility over 5-10 year horizons. Asset allocation backtesting compares expected returns and maximum drawdown across historical periods, providing a quantitative framework for this decision. ...

June 11, 2026 · InvestIQs Research
SCHD in Tax-Free Accounts: Why 20-Year Compounding Beats 2M KRW in Annual Savings

SCHD in Tax-Free Accounts: Why 20-Year Compounding Beats 2M KRW in Annual Savings

SCHD's 3.25% yield — annualizing ~$10.5M USD in distributions across 94.9B AUM (Jan 2026)Tax-free growth over 20 years at 7% average return compounds to 3.87x initial investment, vs. 2.87x after taxes200만원 saved in year 1 becomes 650만원+ in tax-deferred gains by year 10 (no withdrawals)SCHD trades at 19.0 P/E, 480 bps below broader dividend-growth peer VIG (26.0 P/E)Catch: momentum risk is real — SCHD at 52-week high (90.4%), vulnerability to rate shocks and sector rotation The Compounding Angle: Why Simple Tax Savings Miss the Real Picture Monthly $30K investment 20-year compound growth simulation Tax-advantaged accounts create a deceptive math problem. Investors fixate on annual tax savings — 200만원 per year on a 2000만원 contribution — and miss the exponential tail. The real edge comes not from avoiding taxes today, but from letting tax-free dividends reinvest and compound for decades. ...

June 11, 2026 · InvestIQs Research