2022's -25% Drawdown: Why High-Volatility Assets Recovered Twice as Fa
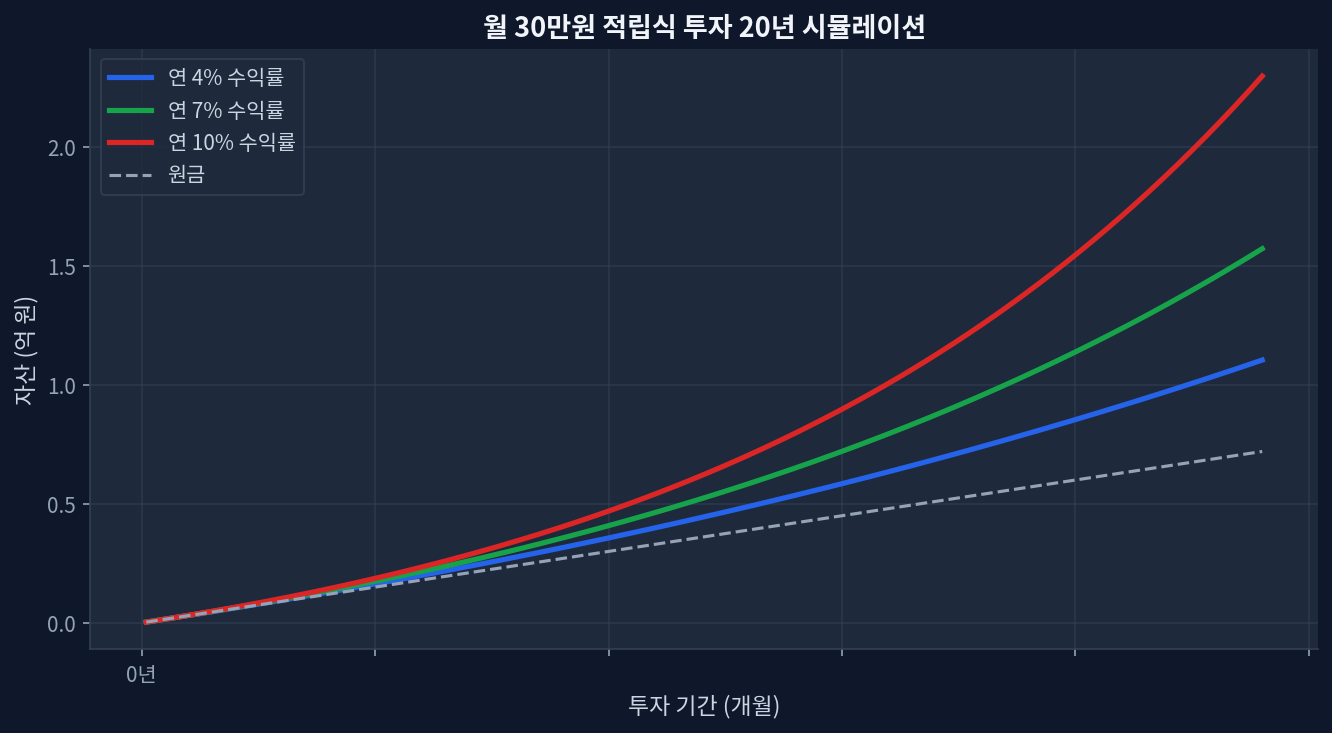
2022 global equity selloff: S&P 500 -18.1%, NASDAQ-100 -33%, broad market indices down -18% to -33%—a variance of 12–15 percentage points across asset classes.Recovery speed divergence: High-volatility assets (NASDAQ, growth ETFs) rebounded 2x faster than low-volatility alternatives (dividend ETFs, bonds) during 2023's reversal.Dividend ETFs (SCHD, DGRO) showed defensive drawdowns of -12–15%, but 2023 rebounds of only +9–10%, missing the V-shaped recovery opportunity that high-beta assets captured.Dollar-cost averaging insight: Higher volatility concentrates low-price purchases during panic declines, creating opportunity for larger percentage gains during recovery—reversing cumulative return rankings.Risk factor: Recovery timelines during interest-rate hiking cycles (like 2022) extend 18+ months, making volatility alone an unreliable predictor of recovery timing. 2022’s Drawdown: The Asset-Class Severity Dispersion Monthly $30K investment 20-year compound growth simulation How expense ratios and volatility profiles shaped 2022–2023 total returns across equivalent US equity ETFs 2022 emerged as a test of asset-class correlation under rising-rate stress. The Federal Reserve’s rate hiking cycle (0.25% in March to 4.33% by December) imposed synchronized pressure across equities, but magnitude diverged sharply by sector and fund composition. ...