Samsung Dividend Reinvestment: Path to 8% Annual Returns Over 5 Years
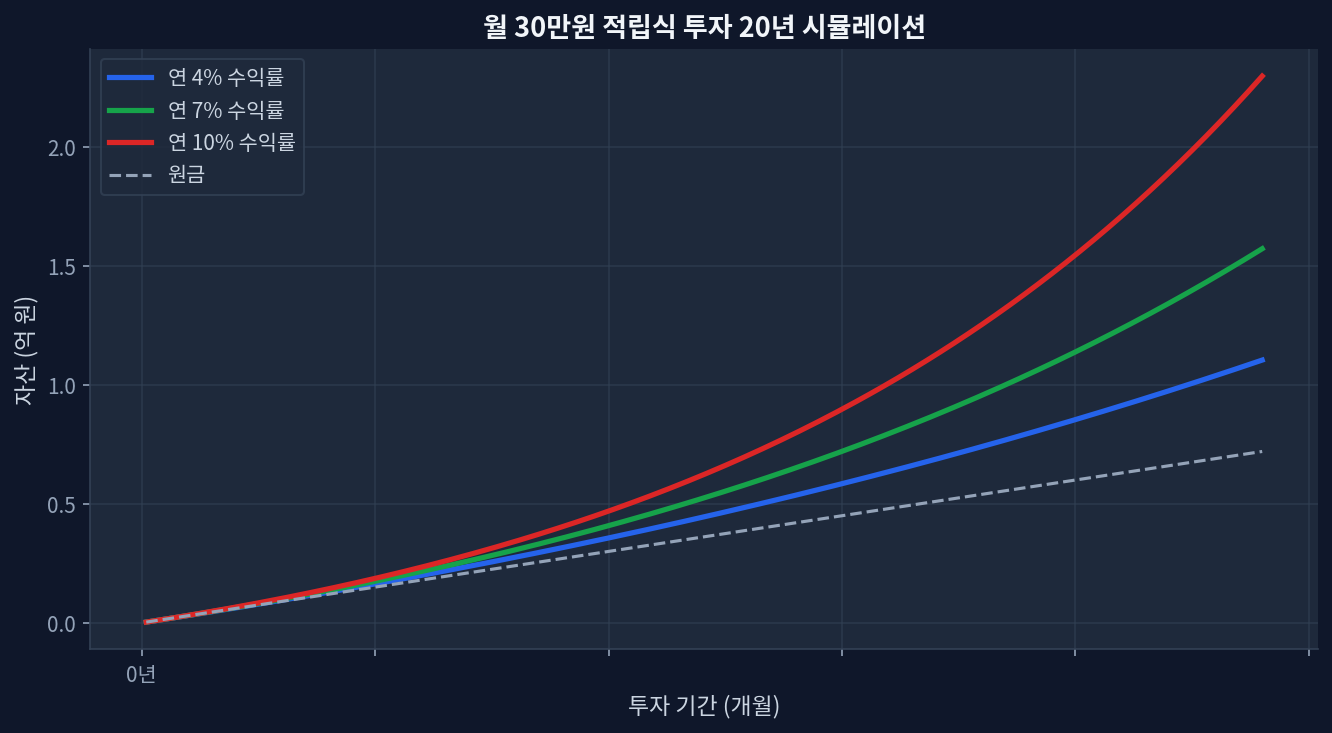
Key TakeawaysSamsung's historical dividend yield averaged 3.2–4.5% over 2020–2026; combined with share-price appreciation, 8% annualized return requires steady market conditionsMonthly $1,500 reinvestment compounds differently across tax-advantaged (Roth/401k) vs. taxable accounts—15% US tax treaty on Korean dividends applies in taxable onlyCurrency risk: KRW/USD volatility can erase 2–3% of gains in down years; hedging costs further reduce net returnsDiscipline matters most—missing dividend reinvestment windows or trading on emotion derails the 8% target more than stock selectionFive-year timeframe is short for equity positions; drawdowns of 20–30% during market corrections are normal and must be endured What 8% Annual Returns Actually Means for Samsung Investors Monthly $30K investment 20-year compound growth simulation Achieving 8% annualized returns on Samsung Electronics over five years requires three moving parts to align: dividend income, share price appreciation, and reinvestment discipline. Most retail investors focus only on the dividend (the visible 3.5% yield) and ignore the harder half—growth and compounding. Samsung’s stock price, denominated in Korean Won, adds an extra layer of complexity: FX exposure can boost returns in strong dollar periods or shred them when the Won appreciates. The math looks clean on a spreadsheet; the reality is messier. ...