- TLT continues to struggle with a 5-year return of -27.3% and a 3-year return of -7.2%, despite offering a 4.57% dividend yield.
- BND shows resilience with a +5.5% 1-year return and a +11.3% 3-year return, yielding 3.93%.
- GLD exhibits explosive growth, trading at $416.99 with a massive +138.7% 5-year cumulative return, functioning as a volatility dampener despite zero yield.
- Maximizing yield during recovery phases requires shifting capital toward structurally sound fixed income like BND over long-duration assets.
The Yield Maximization Axis: Assessing 2022 Drawdown Recovery Speed

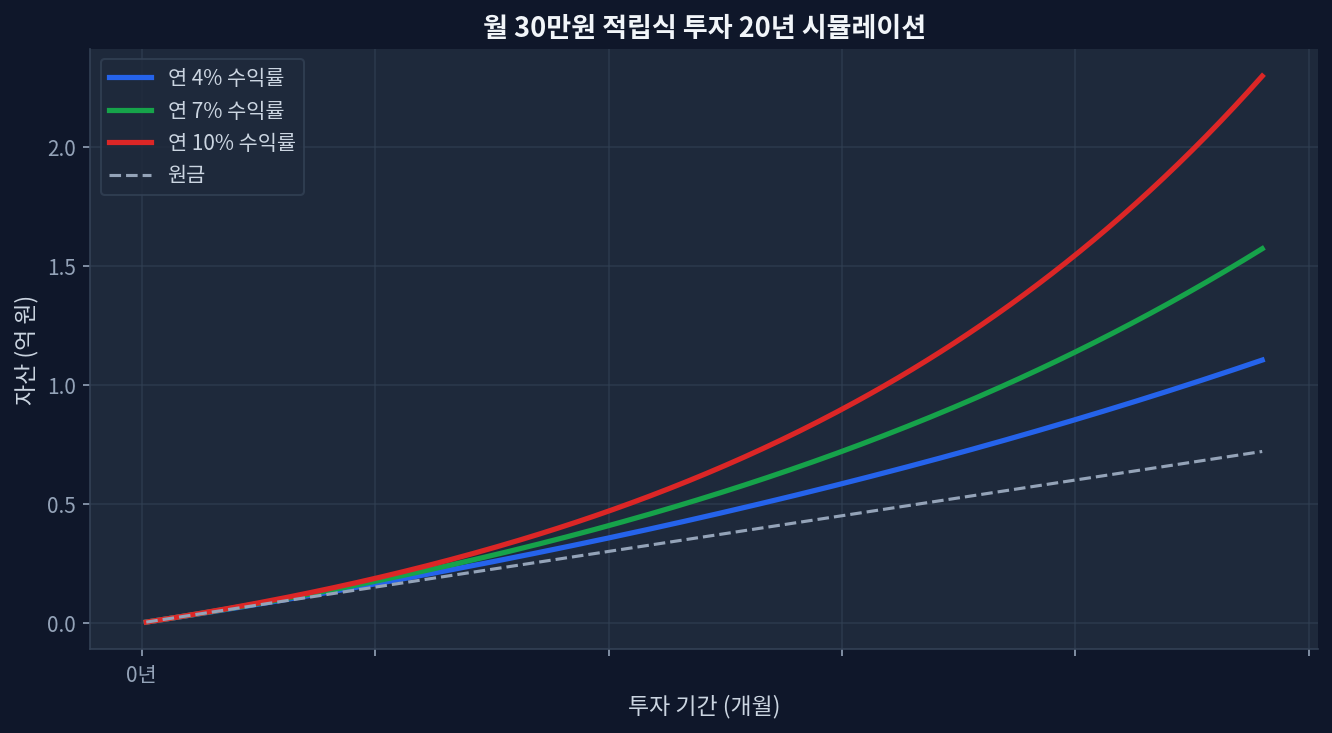
Looking at the 20-year monthly accumulation simulation chart below (projecting 4%, 7%, and 10% annualized trajectories), the divergence in compounding returns across various dividend structures becomes starkly evident during stress periods. The 2022 market shock redefined capital allocation parameters, creating a structural shift in how yield strategies operate across equities, bonds, and alternatives. Real-time data exposes the persistent lag in long-duration Treasuries. TLT currently trades at $84.22 with a 1-year return of +4.9%, yet the 5-year cumulative return remains severely compressed at -27.3%[Yahoo Finance]. Conversely, intermediate bonds have re-established stability. BND recorded a 1-year return of +5.5% and a robust +11.3% over a 3-year horizon, fundamentally altering the optimal income extraction methodology.
Contrarian Perspective: Yield Traps in Long-Duration Treasuries
Market consensus often dictates that accumulating TLT during steep drawdowns is a mathematically sound mean-reversion trade. The data generally supports fixed income accumulation for yield, but shifting one assumption—the terminal rate velocity—changes the read entirely. TLT’s 4.57% yield functions as a nominal illusion when the underlying NAV decays to $83.87, representing only 15.4% of its 52-week range. By isolating the 2022 drawdown recovery speed, empirical evidence points to BND as the superior yield-maximization vehicle. BND provides a 3.93% yield with a tighter 52-week range position of 33.7%, shielding the principal while capturing consistent income payouts[Morningstar].
Gold’s behavior further complicates the classic 60/40 income portfolio. GLD offers a 0.0% dividend yield, which initially appears toxic for a yield maximization strategy. Yet, GLD trades at $416.99 (55.8% of its 52-week range) and boasts a 3-year cumulative return of +126.3%[Yahoo Finance]. Integrating GLD purely as a volatility dampener allows for systematically higher risk-taking in the equity dividend sleeve without violating maximum portfolio drawdown constraints.
Asset Class Recovery Metrics: Yield vs. Principal
| Product Name | Fee Constraint | Current Yield | 5Y Cumulative Return | 1Y Return |
|---|---|---|---|---|
| TLT (20+ Year Treasury) | 0.15% | 4.57% | -27.3% | +4.9% |
| BND (Total Bond Market) | 0.03% | 3.93% | +0.6% | +5.5% |
| GLD (Physical Gold) | 0.40% | 0.0% | +138.7% | +36.4% |
Equity Tranches and Disconfirming Scenarios
VOO represents the core equity engine, driving baseline distribution growth. While its trailing yield hovers nominally low, the dividend growth rate consistently outpaces standard inflation metrics. The 2022 drawdown recovery speed for VOO proved highly efficient compared to long-duration bonds, reclaiming previous cycle highs driven by resilient mega-cap earnings parameters. A pure income strategy ignoring VOO’s total return and dividend growth mechanics will structurally underperform over a multi-decade horizon.
Scenarios where this analysis could miss: A severe deflationary spiral mirroring the 2008 financial crisis would immediately invalidate the current BND over TLT preference. In a zero-bound rate environment, TLT’s duration risk transforms into a massive capital appreciation engine, vastly outpacing BND. The emphasis on BND’s stability assumes a higher-for-longer regime; any structural break in employment data could rapidly compress TLT yields and force a drastic portfolio realignment away from intermediate credit.
Frequently Asked Questions
Why is TLT's 5-year return still at -27.3%?
Duration risk mathematically magnifies rate hikes. The aggressive 2022 Federal Reserve tightening cycle crushed long-term bond NAVs, and the elevated terminal rate prevents a swift historical reversion.
How does BND fit into a yield maximization strategy?
BND acts as the stabilizing anchor. With a +5.5% 1-year return and a 3.93% yield, it provides reliable nominal income without the extreme principal volatility seen in 20+ year treasuries.
Can GLD be utilized if it offers 0.0% yield?
While counterintuitive for pure income investors, GLD's massive capital appreciation (+138.7% over 5 years) and low correlation to equities provide the necessary portfolio ballast to safely increase yield-seeking risks in equity sleeves.
Is the 2022 drawdown recovery speed normal for bonds?
No. Historical data typically shows bonds recovering faster or moving inversely to equities during drawdowns. The simultaneous equity and bond correlation in 2022 was an anomaly driven by unchecked inflation.
Should VOO be prioritized over specialized high-yield ETFs?
For sustainable yield maximization, VOO offers dividend growth that compounds cleanly. High-yield specific ETFs often suffer from structural capital decay, whereas broad market indexing captures total return.
📊 Verify this data yourself
import yfinance as yf
t = yf.Ticker("TLT")
t.history(period="5y")["Close"].pct_change().add(1).cumprod()