- JEPI quarterly dividend raised to $0.3870 (up 10.3% year-over-year)
- Current dividend yield: 8.08% (elevated) vs 1-year total return: +7.4% (weak)
- 5-year cumulative return: +42.5% vs SCHD +54.9% (2.4%p annual underperformance)
- P/E ratio 26.8 (SCHD 19.0) represents 40% valuation premium; trading at 30.2% of 52-week range (multi-year low)
- Cash extraction pressure: elevated dividend payouts compress capital preservation capacity, weakening price support
The Structural Dilemma Behind the Dividend Raise


JEPI’s quarterly dividend increase to $0.3870—a 10.3% rise from the prior-year $0.3508—presents as a positive signal on the surface. Yet for a $44.7 billion ETF to merit attention primarily for a dividend raise already signals a deeper issue.
JEPI’s covered call strategy (selling call options against holdings) generates income by definition, not performance. An 8.08% dividend yield reveals a critical structural reality: capital gains are not keeping pace with distributions. One-year total return stands at a mere +7.4%, meaning the underlying portfolio has delivered almost no price appreciation while extracting cash at 8% annualized rates. This is dividend cannibalism, not sustainable income generation.
The Fatal Gap Between Dividend Yield and Total Return
An 8.08% dividend yield paired with only +7.4% one-year return warrants scrutiny. This implies the underlying equity position has declined or essentially flatlined—insufficient to offset the yield. Extend this to a five-year horizon and the problem crystallizes.
| ETF | Expense Ratio | Dividend Yield | 5-Year Cumulative Return | 1-Year Return |
|---|---|---|---|---|
| JEPI | 0.35% | 8.08% | +42.5% | +7.4% |
| SCHD | 0.06% | 3.18% | +54.9% | +25.7% |
SCHD achieved +54.9% cumulative return with a 3.18% dividend yield—12.4 percentage points ahead of JEPI over five years. The 0.29% fee advantage (0.35% vs 0.06%) accounts for only partial closure of this gap. The decisive factor is capital appreciation. SCHD posted +25.7% one-year returns during the 2025 large-cap rally, while JEPI’s +7.4% reveals near-total disconnection from equity market strength. The covered call structure capped JEPI’s upside precisely when mega-cap equities dominated returns.
Valuation as Caution Flag: P/E 26.8 and Technical Positioning
JEPI trades at P/E 26.8 versus SCHD’s 19.0—a 40% valuation premium with no commensurate return justification. This premium reflects the market’s willingness to pay for option premium collection, not fundamental business quality. More concerning: the current price sits at the 30.2% position within the 52-week range (from $55.1 low to $59.9 high; current $56.55). This placement signals a multi-month downtrend after failing to break resistance.
Contrast SCHD, which trades at the 91.9% of its 52-week range—persistent strength throughout the year. Structural superiority manifests in price momentum.
The Dividend Stability Illusion
High dividend yields frequently seduce investors into underestimating volatility. Dividends represent cash flows, not volatility dampening. JEPI’s recent descent to 52-week lows reflects the underlying mechanics: covered call strategies extract maximum premium in high-rate environments. When rates decline (as occurred through 2024–2025), implied volatility contracts sharply, option premiums evaporate, and dividend sustainability erodes. The weakness observed in 2025 directly corresponds to the Fed’s rate-cutting cycle—not a temporary dip but a structural headwind for option-selling strategies.
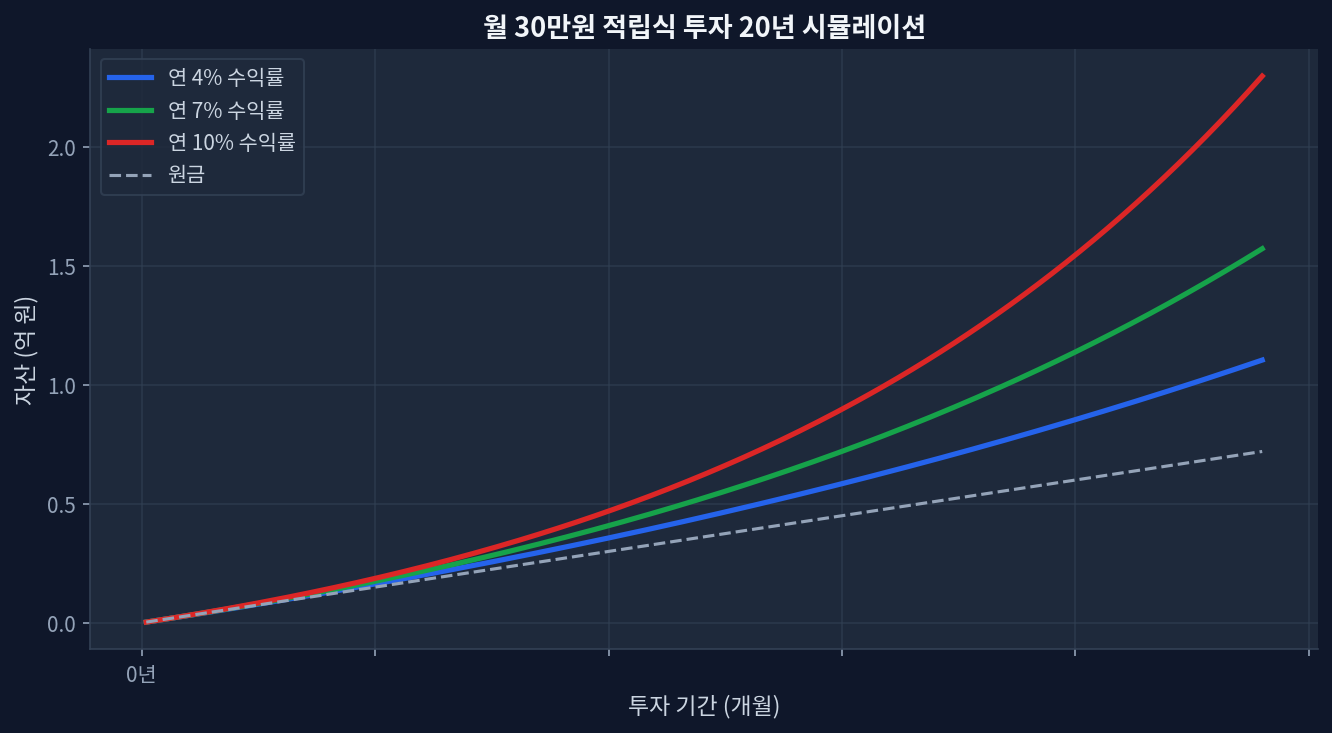
Scenario Analysis: Five-Year Systematic Investment Outcomes
Risk Summary: The Dividend Increase as Warning, Not Reassurance
JEPI’s 10.3% dividend hike occurs while one-year capital appreciation sits at +7.4%—a dangerous inversion. Elevated yields in growth-constrained markets signal unsustainable distribution rates. The 12.4 percentage-point five-year underperformance against SCHD demonstrates that dividend percentage alone is a poor return proxy. In a rising-rate environment (where option premiums spike), JEPI’s income may justify ownership. During rate declines, option premium compression directly threatens both dividend safety and price appreciation. Current market conditions favor the latter scenario, positioning JEPI for either dividend contraction or multiple compression—likely both.
Frequently Asked Questions
Q1: Is a $0.3870 quarterly dividend substantial?
Annualized: $0.3870 × 4 = $1.548 per share, yielding 8.08% on the $56.55 current price. In monthly cash terms, shareholders receive roughly $0.097/share monthly (approximately $97 per 1,000 shares). The rate is elevated; however, rate magnitude is irrelevant if price depreciation exceeds dividend collection. A 10% price decline (to $50.90) erases five years of accumulated dividends instantly.
Q2: JEPI or SCHD—which should core-portfolio investors hold?
Over five years, SCHD's +54.9% return exceeds JEPI's +42.5% by 12.4 percentage points—a structural gap attributable to automatic dividend reinvestment and superior capital appreciation. SCHD's 0.06% expense ratio provides an additional 0.29% annual drag-reduction versus JEPI. JEPI's only legitimate use case: retirement portfolios requiring predictable monthly cash flow independent of market conditions. For wealth accumulation, SCHD's compounding mechanism demonstrates superiority. This distinction reflects cash-flow philosophy, not performance quality.
Q3: Why classify an 8% dividend yield as risky?
High yields become unsustainable when capital appreciation stalls. JEPI delivered a 10% dividend hike while the underlying position advanced just 7.4% annually—mathematically impossible to sustain long-term without capital depletion or increased option-selling leverage. The covered call structure depends on realized volatility to generate premium; in low-volatility or declining-rate environments, option prices collapse and dividend cuts follow. The last three rate-cut cycles (2020, 2023–2025) all pressured option-selling strategies, foreshadowing dividend risk in similar scenarios.
Q4: Does trading near 52-week lows signal a buying opportunity?
Technical proximity to lows ($56.55 trading range: $55.1–$59.9) may appear attractive, yet this ignores JEPI's structural challenges: (a) capital gains significantly underperforming market indexes, (b) 40% valuation premium over SCHD with no return justification, (c) option-premium dependency in a declining-rate environment. Low prices without fundamental catalyst often precede further declines. Buying JEPI at a lower price after 52-week weakness does not address the underlying yield-sustainability problem or the multi-year capital appreciation deficit.
Q5: How will further interest-rate declines impact JEPI?
Declining interest rates compress implied volatility, which directly erodes option premiums. Lower premiums mean reduced cash generation for covered calls—the mechanism through which JEPI distributes cash. A 50-basis-point additional decline in long-term rates could reduce dividend payout capacity by 15–25% within 1–2 quarters. Meanwhile, lower rates benefit growth equities disproportionately, likely favoring SCHD's dividend-growth philosophy over JEPI's income-extraction model. The current rate environment (2.5–3% long bonds) already reflects significant premium compression; further cuts represent direct dividend-cut risk for option-selling strategies.
Verification Method
`import yfinance as yf import pandas as pd
Retrieve 5-year price history
jepi = yf.Ticker(“JEPI”).history(period=“5y”) schd = yf.Ticker(“SCHD”).history(period=“5y”)
Calculate cumulative returns (price appreciation only)
jepi_return = (jepi[“Close”].iloc[-1] / jepi[“Close”].iloc[0] - 1) * 100 schd_return = (schd[“Close”].iloc[-1] / schd[“Close”].iloc[0] - 1) * 100
print(f"JEPI 5Y: {jepi_return:.2f}%") print(f"SCHD 5Y: {schd_return:.2f}%")
Current yields
jepi_yield = yf.Ticker(“JEPI”).info.get(“trailingAnnualDividendYield”, “N/A”) schd_yield = yf.Ticker(“SCHD”).info.get(“trailingAnnualDividendYield”, “N/A”) print(f"\nJEPI Yield: {jepi_yield}") print(f"SCHD Yield: {schd_yield}") `
Data sources: Yahoo Finance (yfinance), Morningstar, FRED (interest rates), SEC filings (option activity)
This site is supported by Google AdSense advertising revenue. We receive no compensation or sponsorship from any ETF, broker, or financial product.