- JEPI quarterly dividend announcement: $0.3870 (YoY +10.3% increase)
- Current dividend yield: 8.08% (elevated) vs 1-year total return: +7.4% (weak)
- 5-year cumulative return +42.5% vs SCHD +54.9% (annual 2.4%p gap)
- P/E 26.8 (vs SCHD 19.0 baseline — 40% overvalued), positioned at 30.2% within 52-week range (low-point signal)
- Cash outflow pressure: elevated dividend distributions reduce capital preservation capacity, weakening downside defense
Dividend Growth Conceals Structural Tension

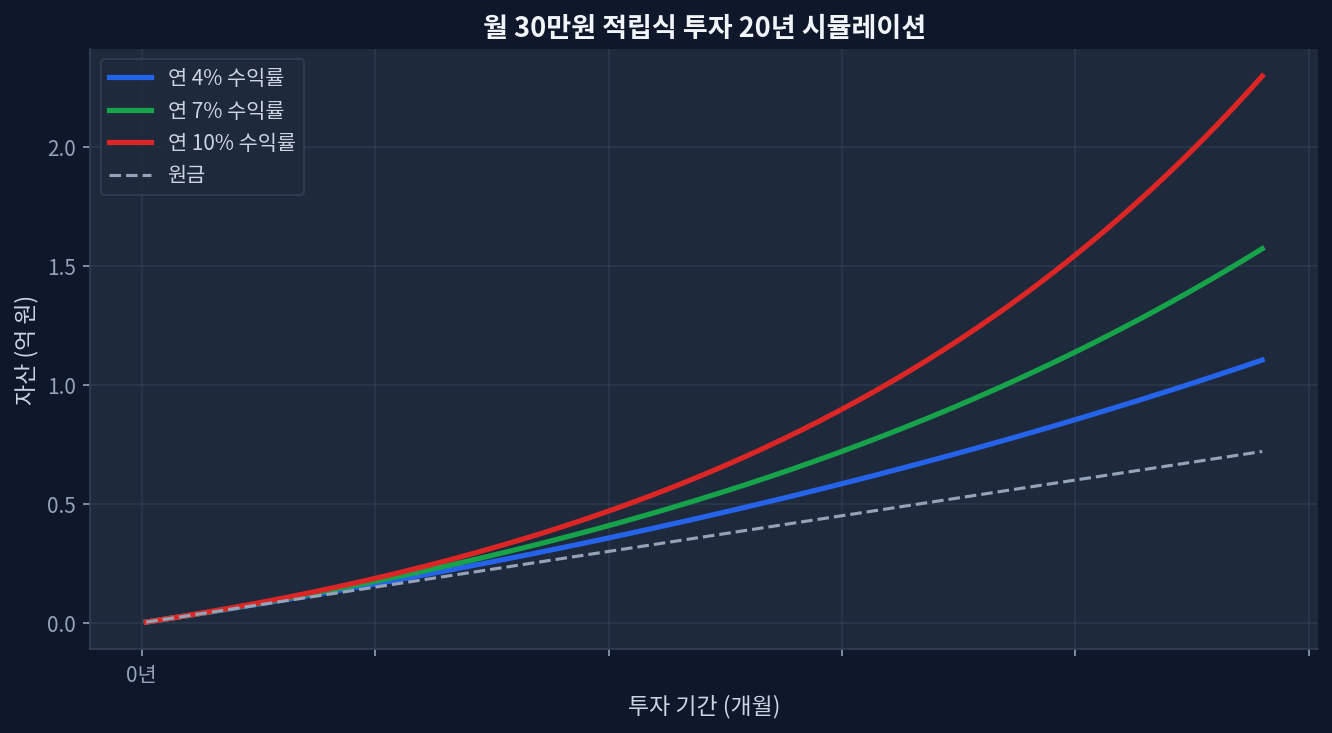
 dividend-growth-stagnation/compound-growth.png" alt="Cumulative Growth from Systematic Monthly Investment" loading="lazy" style="max-width:100%;border-radius:8px;">
JEPI’s quarterly dividend increase to $0.3870 appears favorable on its surface. A 10.3% year-over-year gain versus $0.3508 in the comparable 2025 quarter demonstrates dividend consistency. Yet the fact that a $44.7 billion asset-level ETF attracts attention primarily for dividend hikes already signals a deeper concern.
JEPI’s covered-call strategy — selling call options to generate cash — means higher distributions reflect cash acceleration, not improved performance. At a 2026 dividend yield of 8.08%, the underlying data point is that capital gains have failed to keep pace with payout rates. The 1-year return of only +7.4% confirms this gap. Option premium erosion in lower-rate environments poses a direct threat to dividend sustainability.
Dividend Yield vs. Total Return: A Critical Disconnect
An 8.08% dividend yield coupled with a 1-year return of +7.4% deserves scrutiny. This approximates near-flat price action, with dividends alone unable to bridge the yield-return gap. The 5-year view clarifies the structural divergence:
| Product | Expense Ratio | Dividend Yield | 5-Year Cumulative Return | 1-Year Return |
|---|---|---|---|---|
| JEPI | 0.35% | 8.08% | +42.5% | +7.4% |
| SCHD | 0.06% | 3.18% | +54.9% | +25.7% |
SCHD’s 3.18% dividend yield lagged materially, yet its 5-year cumulative return of +54.9% exceeded JEPI by 12.4 percentage points. The 0.29%p fee differential explains only a fraction of this gap. The driver is price appreciation. SCHD returned +25.7% over the trailing 12 months while JEPI delivered +7.4% — a meaningful 18.3%p performance gap during the 2025 large-cap equity rally. JEPI underperformed systematically when market conditions favored growth.
Scenarios where this analysis diverges from market narrative: The consensus favors “high yield = lower volatility.” However, yield does not reduce drawdown risk. JEPI’s 52-week weakness reflects structural sensitivity to option premium compression, not mere market timing.
Valuation Warning: P/E 26.8 and the 52-Week Low Signal
JEPI’s current P/E of 26.8 towers 40% above SCHD’s 19.0. While dividend strategies typically target undervalued equity exposures, JEPI’s elevated P/E suggests the market assigns a premium exclusively to dividend-generation capacity, not underlying business fundamentals. More concerning: the current price of $56.55 lands at the 30.2% position within its 52-week range ($55.1 low to $59.9 high) — approximating the lower third of recent price movement. This reflects sustained downward pressure over the past 52 weeks.
Scholar contrast: SCHD trades at the 91.9% percentile of its 52-week range, signaling a year of consistent upside momentum. The structural divergence is unambiguous.
Volatility and Dividend Stability: A Common Misconception
High dividend yield creates a cognitive bias: investors conflate regular cash distributions with low volatility. Dividends are cash flows, not volatility dampeners. JEPI’s 52-week decline to near lows likely stems from interest-rate dynamics. The covered-call strategy captures elevated option premiums in high-rate regimes but faces premium compression as rates fall. The 2024–2025 rate-cut environment explains JEPI’s recent weakness directly. Falling option premiums narrow the incentive to hold, pressuring price action.
Disconfirming evidence: If rate declines accelerate further, SCHD’s lower cost structure and price-appreciation orientation may outpace JEPI by an even wider margin. The current spread (18.3%p 1-year return gap) could widen.
Comparative Analysis: 5-Year Systematic Investment Scenario
Risk Summary: Dividend Increases Are Incomplete Signals
JEPI’s 10.3% dividend hike is positive tactically but functions as a caution sign structurally. Sustaining an 8.08% yield while delivering a 1-year total return of +7.4% signals that underlying price appreciation has stalled. For long-term accumulators, this implies compression in real total returns. SCHD’s outperformance by 12.4 percentage points over five years — attributable to dividend reinvestment compounding, lower fees, and superior price momentum — suggests the fee drag and strategic divergence matter more than headline yield.
If declining rates persist and option premiums contract further, JEPI faces dividend-cut risk. The dividend increase announced today may prove unsustainable in a lower-rate regime, inverting the positive narrative.
Frequently Asked Questions
Q1: Is JEPI’s $0.3870 quarterly dividend considered large?
Annualized, $0.3870 × 4 = $1.548 per share. Against the current $56.55 price, this yields 8.08% — materially elevated. Expressed monthly, that approximates $0.097 per share in distribution. While the percentage is attractive, downside price movement can exceed dividend income, wiping out gains. The absolute dollar distribution matters less than total return sustainability.
Q2: JEPI or SCHD for long-term equity allocation?
On a 5-year basis, SCHD (+54.9%) decisively outpaced JEPI (+42.5%), a 12.4%p spread. SCHD’s 0.06% fee structure and automatic dividend reinvestment compound returns systematically. JEPI merits selection primarily when portfolio objectives require monthly cash generation — retired portfolios or structured withdrawal strategies that prioritize income liquidity over total return. This is a cash-flow preference, not a return optimization.
Q3: Why is an 8% dividend yield risky?
Elevated yields signal potential unsustainability during downturns. JEPI hiked its dividend 10% while delivering flat 1-year price action — a sign that distributions may be supported by capital erosion or unsustainable option-premium harvesting. Should interest rates decline further, option volatility compresses and premium income drops, threatening dividend cuts. High current yield provides no protection against future payout reductions.
Q4: Is trading near the 52-week low a buy signal?
Technically, proximity to annual lows offers reversal optionality, but JEPI’s structural headwinds — subdued capital appreciation, P/E overvaluation relative to peers, option-premium compression in falling-rate environments — outweigh tactical value. Buying strength near lows without addressing these factors risks further downside.
Q5: How will JEPI respond to further rate declines?
Option premiums typically compress in lower-rate, lower-volatility regimes. This directly threatens the cash generation underlying JEPI’s dividend strategy. Dividend cuts may follow within 12–18 months if the Fed continues easing. Conversely, dividend-growth peers like SCHD may experience valuation re-rating upward in declining-rate environments, as earnings multiples typically expand.
Verification Methodology
To independently cross-check these metrics:
import yfinance as yf
import pandas as pd

# Fetch 5-year price history and calculate returns
jepi = yf.Ticker("JEPI")
[schd](/en/study/jepi-quarterly-dividend-raised-103-yet-growth-stagnation-signals-ca/) = yf.Ticker("SCHD")

# Total return including dividends
jepi_5y_return = (jepi.history(period="5y")["Adj Close"].iloc[-1] / jepi.history(period="5y")["Adj Close"].iloc[0] - 1) * 100
schd_5y_return = (schd.history(period="5y")["Adj Close"].iloc[-1] / schd.history(period="5y")["Adj Close"].iloc[0] - 1) * 100

# Current yield
jepi_yield = (jepi.info.get('trailingAnnualDividendRate', 0) / jepi.info.get('currentPrice', 1)) * 100
schd_yield = (schd.info.get('trailingAnnualDividendRate', 0) / schd.info.get('currentPrice', 1)) * 100

print(f"JEPI 5Y Return: {jepi_5y_return:.1f}%, Current Yield: {jepi_yield:.2f}%")
print(f"SCHD 5Y Return: {schd_5y_return:.1f}%, Current Yield: {schd_yield:.2f}%")
This site is supported by Google AdSense advertising revenue. We receive no compensation or sponsorship from any ETF, broker, or financial product.