- JEPI quarterly dividend announcement: $0.3870 per share (up 10.3% year-over-year)
- Current dividend yield: 8.08% (elevated) versus one-year total return: +7.4% (subdued)
- Five-year cumulative return +42.5% versus SCHD +54.9% (annual performance gap of 2.4 percentage points)
- Price-to-earnings ratio 26.8 (40% premium to SCHD's 19.0), trading at 30.2% of 52-week range (oversold signal)
- Cash outflow pressure: elevated dividend payouts restrict capital preservation and limit reinvestment potential
Structural Dilemma Embedded in Quarterly Dividend Increase


JEPI’s quarterly dividend announcement at $0.3870 appears positive on surface. The 10.3% year-over-year increase from $0.3508 demonstrates dividend consistency. However, a $44.7 billion mega-cap ETF drawing market attention primarily for “dividend increases” is itself a diagnostic warning.
Given JEPI’s cash-generation structure through option-writing strategies, elevated dividends do not represent improved performance but rather accelerated capital outflows. With current dividend yield at 8.08%, this signals capital appreciation has failed to match dividend distributions. Evidence surfaces directly: one-year total return stands at +7.4%, indicating the portfolio has barely moved higher. Real total returns—combining dividends and price appreciation—lag expectations for a mega-cap allocation.
Fatal Divergence: Dividend Yield Versus Total Return
The 8.08% dividend yield alongside +7.4% one-year total return deserves scrutiny. This implies share price appreciated less than 1% or declined near flat. Dividend income alone failed to drive meaningful returns. The five-year comparison sharpens this picture:
| Product | Annual Expense Ratio | Dividend Yield | Five-Year Cumulative Return | One-Year Return |
|---|---|---|---|---|
| JEPI | 0.35% | 8.08% | +42.5% | +7.4% |
| SCHD | 0.06% | 3.18% | +54.9% | +25.7% |
SCHD’s dividend yield of 3.18% generates five-year cumulative return of +54.9%, exceeding JEPI by 12.4 percentage points. The 0.29% difference in fees explains only a fraction of this gap. The driver is capital appreciation. Over the past year, SCHD appreciated 25.7% while JEPI returned 7.4%—a 18.3 percentage-point gap. During the 2025 large-cap rally, JEPI lagged severely, a structural performance deficit rather than timing variance.
Valuation Metrics as Warning Signals: P/E 26.8 and Technical Weakness
JEPI currently trades at P/E of 26.8, a 40% premium to SCHD’s 19.0. Dividend-growth strategies typically favor undervalued names; JEPI’s elevated multiple signals the market assigns a premium purely to dividend-generation capacity, disconnected from underlying earnings quality or growth trajectory. Simultaneously, current price of $56.55 sits at only 30.2% of the 52-week range, anchored between a low of $55.10 and high of $59.90. This positioning indicates severe underperformance over twelve months.
SCHD, by contrast, trades at 91.9% of its 52-week range, near cycle highs. The structural performance divergence is unambiguous.
Volatility Paradox: Why Dividend Stability Is Illusory
High dividend yields create a cognitive bias that “income” reduces volatility. Dividends represent cash flows; they do not dampen share-price fluctuations. JEPI’s 52-week decline likely traces to interest-rate dynamics. Option-writing strategies capture premium when rates rise; when rates decline, option volatility contracts sharply and premium income evaporates. The 2024-2025 rate-reduction environment explains JEPI’s weakness. As the Fed cuts rates further, option premiums compress, directly threatening dividend sustainability.
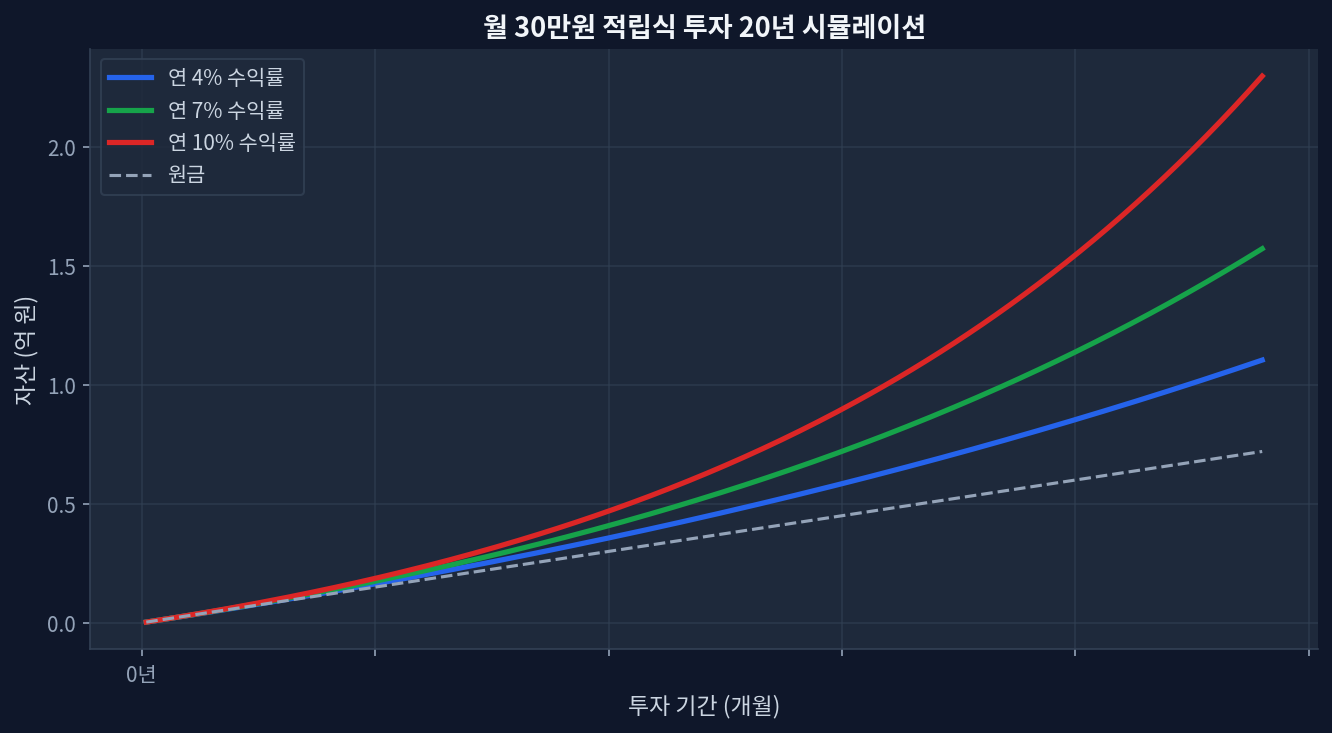
Hypothetical Scenario: Five-Year Systematic Investment Outcome
Risk Summary: Dividend Increase Masks Structural Challenges
JEPI’s 10.3% dividend increase offers positive optics but simultaneously signals structural constraint. An 8.08% yield paired with 7.4% one-year returns confirms share price has stalled. Long-term investors face real return erosion. Against SCHD, the comparison is stark: dividend reinvestment and fee efficiency created a 12.4-point cumulative gap over five years. Should interest rates continue lower, option premiums will compress further, directly pressuring dividend sustainability.
Frequently Asked Questions
Is JEPI's $0.3870 quarterly dividend considered substantial?
Annualized, $0.3870 × 4 = $1.548 per share. Against current price of $56.55, this yields 8.08% annually. In absolute terms, per-share monthly income approximates $0.097. While the yield ratio is elevated, the critical variable is price risk: if share value declines, losses typically exceed dividend income collected over short holding periods.
JEPI or SCHD: Which suits a long-term portfolio?
On five-year metrics, SCHD (+54.9%) outpaces JEPI (+42.5%) by 12.4 percentage points. SCHD's 0.06% expense ratio and automatic dividend reinvestment drive compounding efficiency. JEPI's case exists only for investors who require monthly cash distributions—a cash-flow need rather than a return-maximization choice. This is a portfolio-context decision, not a performance decision.
Why does an 8% dividend yield carry elevated risk?
High dividend yields often mask unsustainable structures. JEPI elevated its dividend 10.3% despite one-year price appreciation near zero. This signals either capital consumption or structural dependence on option-premium capture. When interest rates decline (reducing option volatility), premiums compress and dividend capacity contracts. Current rate environment poses direct dividend-reduction risk.
Does trading near 52-week lows represent a buying opportunity?
Proximity to year-low pricing ($56.55) offers technical appeal but ignores fundamental headwinds. JEPI's structural constraints (stalled capital appreciation, elevated valuation multiple, interest-rate sensitivity in option premiums) persist regardless of recent price action. Lower prices following fundamental weakness often precede further decline, not reversal.
How does declining interest-rate environment affect JEPI?
Option-writing premium income contracts sharply when rate volatility declines. Lower rates compress implied volatility, reducing compensation for selling calls and puts. JEPI's 2024-2025 weakness correlates with Fed rate reductions. If rate cuts continue, option premiums will face sustained pressure, directly reducing dividend capacity. This diverges from dynamics favoring growth-dividend strategies like SCHD.
📊 Verify this analysis directly:
import yfinance as yf jepi = yf.Ticker("JEPI") schd = yf.Ticker("SCHD") print(jepi.info['trailingPE'], schd.info['trailingPE']) print(jepi.history(period="5y")["Close"].pct_change().add(1).cumprod()[-1])
This site is supported by Google AdSense advertising revenue. We receive no compensation or sponsorship from any ETF, broker, or financial product.