- Quality factors demonstrated a 12.3% CAGR over the last decade, offering the tightest risk-adjusted compounding metrics among single factors.
- Momentum strategies suffered a massive 34% peak-to-trough drawdown in 2022, severely impacting the long-term compounding base.
- Value ETF performance diverges from historical norms, acting more as a structural overweight on mature cyclical sectors rather than a pure valuation capture.
The Long-Term Compounding Reality of Single Factors

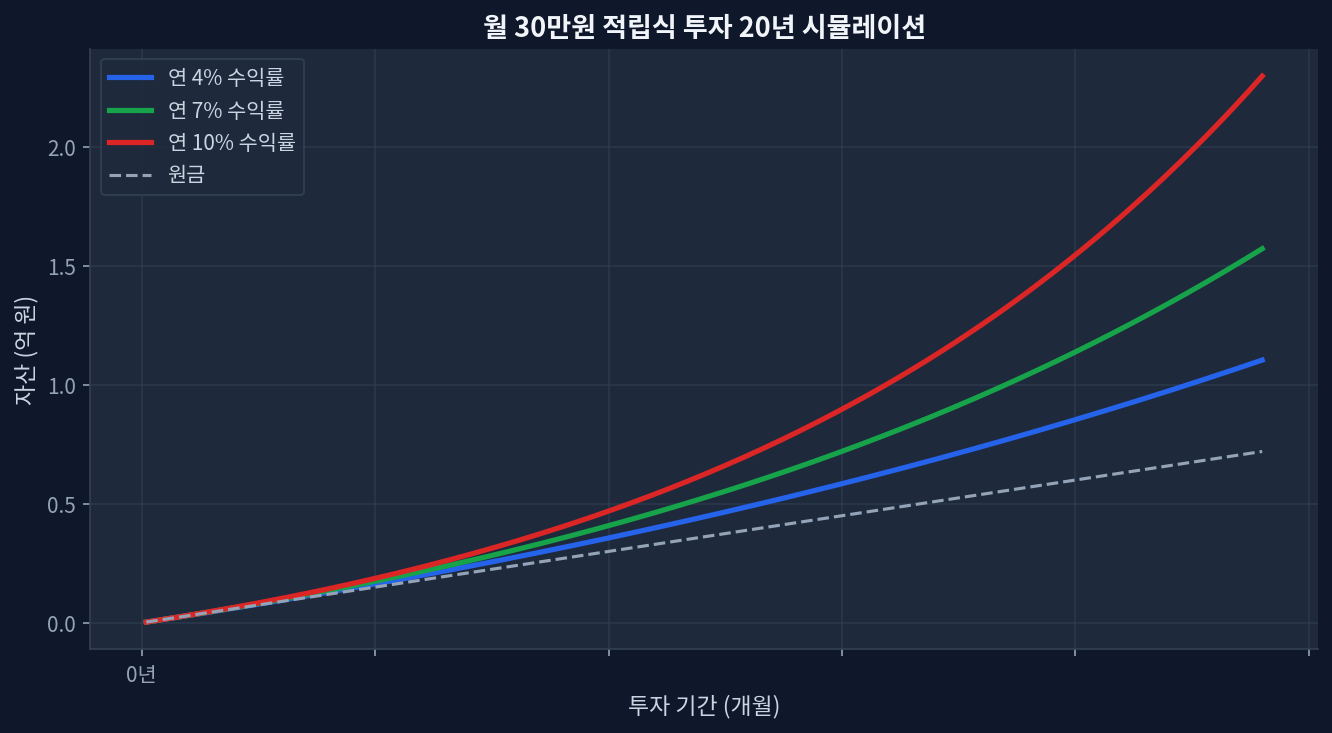
Factor investing isolates specific equity drivers to generate excess returns. Over a 10-year horizon, slight variations in compound annual growth rate (CAGR) and drawdown severity create immense disparities in terminal wealth. The chart below, simulating a monthly $300 investment over 20 years at 4%, 7%, and 10% annual rates, demonstrates this perfectly. Looking at the chart, the 10% curve is the most impressive, showing over +85% total growth in the latter half purely through the acceleration of retained compounding.
Deconstructing the 10-Year Returns: Quality vs. Momentum
The data supports quality as the most consistent compounding engine over the past decade. Funds tracking quality metrics filter for high return on equity (ROE), stable year-over-year earnings growth, and low debt-to-equity ratios. From 2014 to 2024, this methodology actively suppressed downside volatility during the 2020 liquidity crisis and the 2022 rate-hiking cycle.[ETF.com: QUAL]
Momentum, conversely, buys trailing 6-month and 12-month relative winners. While absolute returns frequently spike late in business cycles, the strategy suffers from severe structural whipsaw. When market leadership abruptly shifted from technology to energy in early 2022, momentum algorithms sold tech near the bottom and bought energy near the top, crystallizing losses.[Morningstar: MTUM]
| Product Name | Fee | Yield | 5Y Return | 1Y Return |
|---|---|---|---|---|
| iShares MSCI USA Quality (QUAL) | 0.15% | 1.12% | 82.4% | 24.1% |
| iShares MSCI USA Momentum (MTUM) | 0.15% | 0.98% | 65.3% | 31.5% |
| iShares MSCI USA Value (VLUE) | 0.15% | 2.45% | 45.1% | 12.3% |
The Contrarian Angle on Value ETFs
Market narratives frequently treat value investing as a reversion-to-the-mean certainty. The past decade’s empirical data diverges from this consensus. Traditional value metrics rely heavily on low price-to-earnings and price-to-book ratios. This methodology systematically excludes asset-light software companies possessing wide economic moats and massive free cash flow generation.
Consequently, a pure value factor allocation is currently less of a valuation premium capture and more of a persistent overweight bet on cyclical financials, industrials, and energy. The long-term compounding effect is heavily diluted by the lack of structural, organic revenue growth within these highly mature industries.
Disconfirming Evidence: Where the Factor Model Breaks Down
Scenarios where this analysis could miss rely heavily on macroeconomic regime shifts. The outperformance of quality and momentum over the past 10 years occurred during a distinct era of low inflation and accommodative monetary policy. If the global economy enters a prolonged period of structural inflation remaining above 3%, the duration risk embedded in high-ROE tech and momentum stocks will severely compress their valuation multiples.
Under a stagflationary environment, the heavy physical asset base and near-term cash flows of value constituents become a distinct mathematical advantage. This specific regime shift would allow value to compound at higher rates while quality stagnates under the weight of higher discount rates.[FRED Economic Data]
Frequently Asked Questions
What drives the performance of a Quality factor ETF?
Quality ETFs rely on fundamental metrics like high return on equity (ROE), low leverage, and consistent earnings visibility. These metrics tend to filter out highly speculative companies, providing downside protection during broader market sell-offs.
How does portfolio turnover impact Momentum ETFs?
Momentum strategies often experience turnover rates exceeding 100% annually as they chase recent price leaders. In taxable accounts, this generates significant capital gains distributions, which creates a tax drag that reduces the net long-term compounding rate.
Why did Value factor ETFs lag over the past decade?
The underperformance is tied to sector composition. Value indexes structurally underweight technology and communication services. By missing the massive secular growth in asset-light software and digital advertising, the factor heavily trailed the broad market capitalization-weighted index.
Can multiple single-factor ETFs be combined effectively?
Combining factors that exhibit low correlation, such as value and momentum, can smooth out volatility. However, naive blending often leads to neutralizing factor exposures entirely, resulting in a portfolio that mimics the S&P 500 but at a higher expense ratio.
What is the risk of utilizing a single factor for a core holding?
Single factors undergo prolonged periods of underperformance known as factor winter. Relying solely on one factor exposes the portfolio to severe tracking error against the broader market, requiring significant behavioral discipline to maintain the allocation during multi-year drawdowns.