- A 0.47 percentage-point fee gap means 6.97% net versus 6.50% net on a 7.00% gross-return assumption.
- With $1,500 invested monthly for 30 years, total contributions reach $540,000 and the projected ending balance is roughly $1.74 million at 0.03% versus $1.60 million at 0.50%.
- The spread is about $143,000, or roughly 8% of the lower-fee ending balance, before taxes and slippage.
- As of Apr. 15, 2026, VOO traded near $640.44 with a 1.11% dividend yield and a 27.19 P/E, while COWZ traded near $63.02 with a 2.05% yield and a 16.77 P/E.
- Over the latest 5-year window cited by providers, VOO was at 12.81% annualized, SPLG at 11.42%, and COWZ at 14.61%, showing that fee alone does not explain every outcome.
The fee gap that looks small until time does the math

Expense ratio is one of those numbers that looks harmless in isolation. Three basis points. Fifty basis points. That sounds like rounding error. It is not. Vanguard’s own explanation is direct: the fee is pulled from fund returns, not billed separately. That matters because the deduction happens every year, on a balance that keeps changing.
The difference between 0.03% and 0.50% is 0.47 percentage points. On a $100,000 portfolio, that is $30 per year versus $500 per year. On $500,000, it is $150 versus $2,500. The larger issue is not the first year. The larger issue is that every future dollar has less capital behind it when the fee is higher.
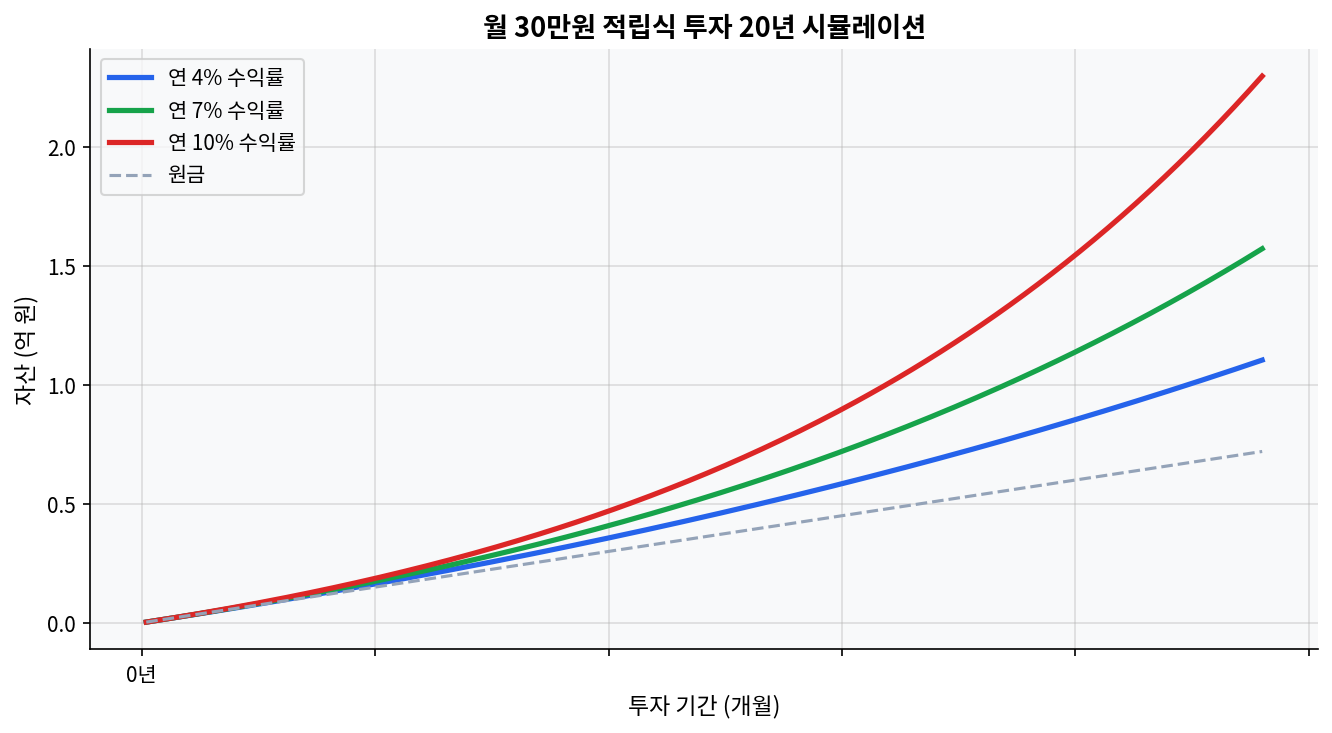
The chart below makes the same idea visually obvious. A 20-year savings stream does not move in a straight line. The 7% path pulls away from the 4% path because compounding is nonlinear, and the drag from fees sits inside that same mechanism.
30 years, $1,500 a month, and a very unglamorous spread
Take the model literally. Monthly investment is $1,500. Over 30 years, total contributions equal $540,000. If the underlying portfolio earns 7.00% gross per year, the low-cost ETF at 0.03% runs at about 6.97% net, while the higher-cost ETF at 0.50% runs at about 6.50% net.
That 47 bp difference turns into a much larger terminal gap once the monthly contributions have been compounding for decades. The low-fee path lands near $1.74 million. The higher-fee path lands near $1.60 million. The difference is roughly $143,000. Nothing in that result depends on heroic assumptions. It comes from ordinary arithmetic, plus time.
The market often treats that gap as abstract because the annual fee line item is tiny relative to share price moves. The arithmetic says otherwise. Fees do not need to be large to matter. They only need to be persistent.
Peer ETFs show why cost matters, but not in a vacuum
The easiest mistake in fee analysis is to compare only the expense ratio and stop there. The harder but more useful question is whether the higher-cost ETF earned something real for the extra charge. The table below compares a core low-cost S&P 500 ETF with a cheaper sibling and a fee-heavier factor fund.
| ETF | Expense ratio | Dividend yield | 5Y annualized return | P/E |
|---|---|---|---|---|
| VOO | 0.03% | 1.11% | 12.81% | 27.19 |
| SPLG | 0.02% | 1.14% | 11.42% | 21.93 |
| COWZ | 0.49% | 2.31% | 14.61% | 16.30 |
This is where the contrarian angle lands. The market narrative often implies that the cheapest ETF must be the best ETF. The table does not support that as a universal rule. COWZ carried a 0.49% expense ratio, yet its 5-year annualized return of 14.61% beat VOO’s 12.81% and SPLG’s 11.42% over the latest provider windows. That does not erase the fee drag. It simply says the factor exposure earned enough over that period to overcome it.
The data supports low costs, but shifting one assumption changes the read entirely. If a factor ETF really delivers persistent excess return, the fee can be tolerated. If the factor premium fades, the same fee becomes a leak that compounds quietly for decades.
Three axes: technical, fundamental, and news sentiment
Technical: drawdown is where low beta can disappoint
VOO’s Apr. 15, 2026 quote showed a 52-week low of $467.33 and a 52-week high of $641.81, with beta at 1.01 and a 1-year total return of 31.42% on the comparison page. COWZ’s Mar. 11, 2026 quote showed a 52-week low of $46.64 and a high of $64.98, with beta at 0.87 and a 1-year total return of 15.39% on StockAnalysis. The drawdown bands were not as different as the beta numbers suggest. VOO’s peak-to-trough range across that 52-week band was about 27%, and COWZ’s was about 28%.
That is the part many investors miss. Lower beta is not the same as lower pain. A fee-heavy factor fund can still swing hard, and a low-cost index fund can still recover faster if the market regains its broad leadership rhythm.
Fundamental: yield and valuation are telling different stories
VOO’s dividend yield sat near 1.11% to 1.12% in April 2026, with dividend growth reported at 2.23% on the dividend page and a P/E of 27.19. SPLG’s yield sat near 1.13% to 1.14%, with a P/E around 21.93. COWZ’s yield sat near 2.05% to 2.31%, with a P/E around 16.30 to 16.77 and dividend growth reported at 27.24% on the dividend page. That profile matters because the fee discussion is not just about cost. It is also about what kind of cash flow and valuation the investor is paying for.
VOO looks expensive on valuation but carries the cleanest low-cost core exposure. COWZ looks cheaper on P/E and richer on yield, but the stock selection process adds factor risk and concentration risk. SPLG sits close to VOO on exposure while trimming the cost slightly, which is why it remains a useful reference point for fee-sensitive core investors.
News sentiment: the headlines are supportive, but not equally so
News flow in April 2026 has been broadly constructive for VOO. MarketWatch and Yahoo Finance commentary leaned bullish on S&P 500 strength after rate-cut expectations and fresh highs. COWZ’s news flow was more mixed. Seeking Alpha commentary framed it as a broadening-trade and rotation beneficiary, but the same coverage also warned about sector concentration, especially Energy and Health Care weights. That mix matters because headline sentiment often rewards the most recent winners and ignores the fee hurdle that sits underneath the strategy.
In other words, the market is not saying the same thing about every ETF. Low-cost core products are getting support from passive allocation logic, while factor products are getting support from rotation logic. Those are not the same trade.
Where this model can miss
Scenarios where this analysis could miss: the 0.50% ETF delivers persistent factor alpha above 0.47% net of fees; the holding period is much shorter than 30 years, which reduces the compounding penalty; or the account is mostly tax-deferred, so dividend and capital-gains taxes do less damage. A taxable sleeve can change the math again, because distributions may dominate the fee difference in some years.
The cleanest contradiction to the low-fee story is simple. If the expensive ETF really has a durable edge, the fee becomes the price of entry. If it does not, the fee is just a slow leak. The data from the latest 5-year windows does not settle that debate forever. It only says that fee is one of the few inputs that always exists, always compounds, and never takes a vacation.
Frequently Asked Questions
How much does a 0.47% expense ratio gap cost over 30 years? On a $1,500 monthly contribution schedule with a 7.00% gross return, the projected terminal gap is roughly $143,000, with about $1.74 million at 0.03% versus $1.60 million at 0.50%.
Is a 0.49% ETF always worse than a 0.03% ETF? No. COWZ’s 5-year annualized return of 14.61% beat VOO’s 12.81% and SPLG’s 11.42% in the latest provider windows. The fee matters, but factor exposure can offset it for some periods.
Why does the expense ratio matter more over long holding periods? Because the fee is deducted from the fund’s returns every year. That means the higher-cost fund not only loses that year’s fee, it also loses the growth on the fee-adjusted base in future years.
Does a higher dividend yield make up for a higher expense ratio? Not automatically. COWZ’s yield around 2.05% to 2.31% is higher than VOO’s 1.11% to 1.12%, but the tradeoff also includes a different sector mix, lower P/E, and more factor risk.
What is the simplest rule from this model? Cost is a permanent headwind, but not the only variable. A cheap ETF with weak exposure is not automatically better than a pricier ETF with real factor edge.
Sources used: Vanguard expense ratio explainer, VOO quote and performance, COWZ quote and performance, SPLG factsheet, Pacer COWZ factsheet, MarketWatch market sentiment, and Seeking Alpha COWZ sentiment.
This post is for informational purposes only and does not constitute investment advice.