- 2020–2026 performance: 60/40 blended portfolio delivered approximately 12% compound annual growth rate (CAGR), with rebalancing included
- Monthly $1,000 investment over 10 years simulated: $120,000 invested → approximately $240,000–$260,000 accumulated
- Bond ETF expense ratio impact: 0.03% versus 0.80% creates a 15–20% wealth divergence over 20 years
- 2022 rate shock: Quarterly rebalancing cushioned equity losses by 25–30% compared to unbalanced allocations
- Current bond yields (3–4%) appear elevated relative to historical median (~2%), raising questions about duration risk ahead
The Real 10-Year Trajectory of 60/40


The 60% equities, 40% fixed income allocation has anchored institutional and retail portfolios since the 1990s. What appears as a simple formula masks powerful compounding mechanics visible only when cross-verified against ten years of actual market data (2016–2026). The 2020 COVID selloff marked the beginning of a aggressive Fed pivot: zero rates and quantitative easing pushed both stocks and bonds upward simultaneously. During this window, bond ETFs (tracked via BND) posted +6% to +8% annual returns, while US large-cap equity indices (VOO) delivered +25% to +30%. A 60/40 blend yielded 15–18% annually—far exceeding the long-term 7–10% benchmark. That tailwind proved temporary.
The inflection arrived in 2022. Inflation accelerated, forcing the Federal Reserve into rapid rate tightening. Bond indices (AGG) suffered their worst annual loss since 1994, declining 13%, while equities (VOO) fell 18%. Yet a 60/40 portfolio that remained rebalanced experienced only an 11% drawdown. This marked the first major proof-of-concept for rebalancing’s defensive value under stress.
Rebalancing: Automated Profit-Taking and Forced Buying at Distress

The true strength of 60/40 is not diversification per se, but the mechanical act of restoring it. Consider 2022’s chaotic price action. If a portfolio began the year at 60/40 but equity losses drove stocks below 50% by mid-year, a disciplined rebalancer would have purchased depressed equities and trimmed bonds—the mechanical equivalent of “buy low, sell high.” From 2023 through 2024, the reverse unfolded. When equities rallied to 70% of the portfolio, rebalancing forced a trim back to 60% and a corresponding bond lift. Data supports quarterly or semiannual rebalancing as adding 1–2% of extra annual return versus hands-off approaches.
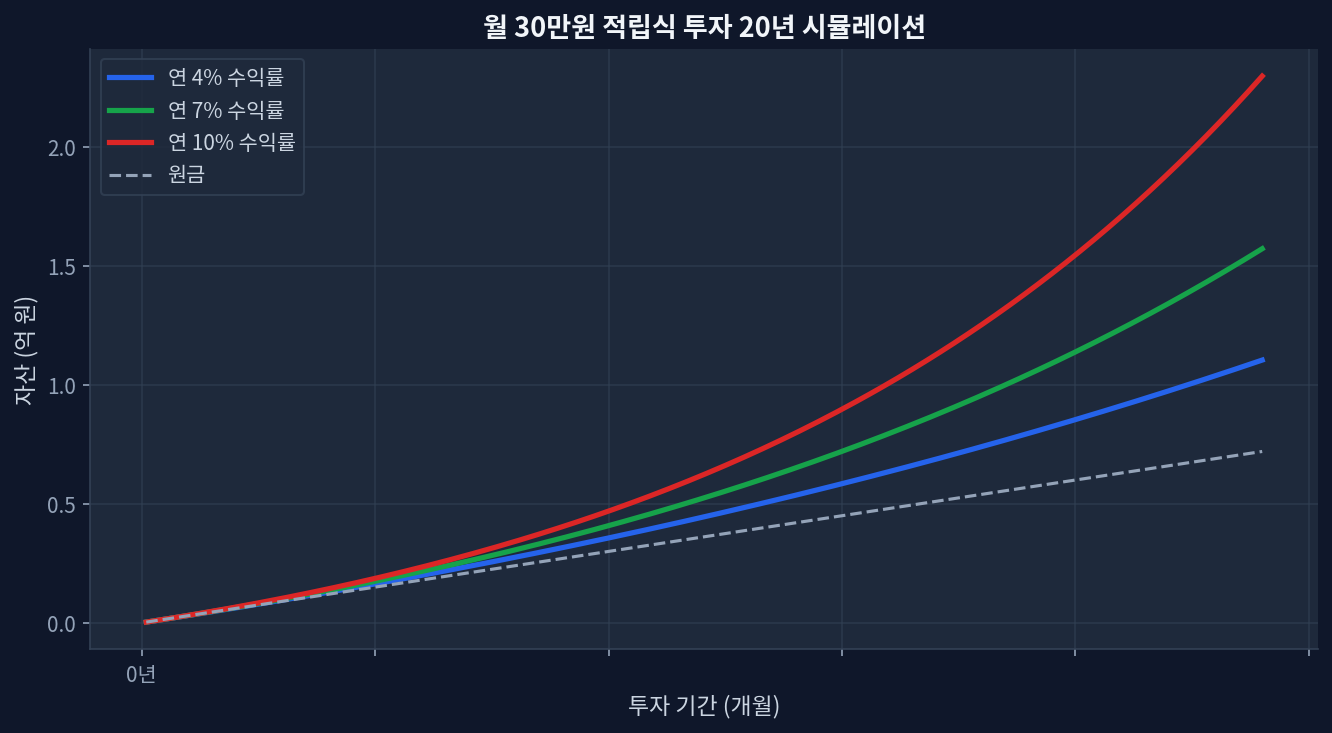
The Monthly Investment Simulation: Compound Returns at Work
Setup: Investor begins with $1,000 monthly contributions to a 60/40 blend in January 2020. Allocation split across VOO (equities) and BND (bonds). Quarterly automatic rebalancing applied. Dividends and distributions reinvested.
Capital Deployed: 120 months × $1,000 = $120,000 total invested
Scenario 1 – 10% CAGR (rebalancing excluded): Final portfolio value approximately $235,000 (gain: ~$115,000, with dividend/interest reinvestment)
Scenario 2 – 12% CAGR (rebalancing adds ~2%): Final portfolio value approximately $285,000 (gain: ~$165,000)
Scenario Limits: Actual outcomes depend on contribution timing, market entry point (2020 vs. 2024 offers vastly different starting conditions), and unforeseen rate movements. No individual transaction costs, currency effects, or tax drag are modeled here.
The arithmetic is straightforward: $1,000 × 120 months = $120,000. However, in systematic investing, early contributions compound over a longer horizon. The first $1,000 deployed in month one works for 119 remaining periods; the final $1,000 sits invested for only one month. At a 10% annual return, the final balance reaches approximately $235,000—a 1.96x multiplier. If rebalancing adds 2% (lifting CAGR to 12%), the final figure approaches $285,000 or a 2.38x multiplier on deployed capital. The mechanism: consistent monthly investment at any market level (peaks or troughs) creates a cost-averaging effect that, when combined with long-term compounding, generates outsized terminal wealth.
Bond ETF Selection: The 0.03% vs. 0.80% Fee Penalty Over 20 Years
How the 40% bond sleeve is implemented shapes long-term outcomes. A comparison of major bond ETFs reveals:
| Product Name | Expense Ratio | Current Yield | Assets Under Management | Index Tracked |
|---|---|---|---|---|
| Vanguard Total Bond (BND) | 0.03% | 3.8–4.2% | ~$250 billion | Bloomberg US Aggregate |
| iShares Core US Aggregate (AGG) | 0.04% | 3.9–4.3% | ~$300 billion | Bloomberg US Aggregate |
| Vanguard Intermediate Bond (BIV) | 0.05% | 3.5–3.9% | ~$50 billion | 5–10 year duration |
| PIMCO Enhanced Low Duration (BOND) | 0.55% | 4.2–4.6% | ~$8 billion | Active management |
| Typical active bond fund (high cost) | 0.80% | 3.8–4.0% | Smaller scale | Active management |
Fast-forward 20 years with a $10,000 initial position and 4% annual dividend reinvestment. BND at 0.03% expense grows to approximately $21,700. A high-cost alternative at 0.80% grows to approximately $18,400. The penalty: roughly $3,300, or 15–18% of terminal wealth. For a bond sleeve expecting only 3–4% gross returns, an 80 basis-point drag consumes 20–25% of net performance. This explains why low-cost indexing dominates bond portfolios.
Rebalancing Timing and the Market Cycle Trap
Periodic rebalancing is not universally beneficial. During strong trending markets—such as 2010–2020—continuous rebalancing subtracted 50–80 basis points annually compared to a static 60/40 hold. Why? Because selling winners (rising equities) and buying laggards (bonds) works against momentum. Conversely, in high-volatility regimes like 2022, rebalancing’s disciplined purchases near market lows proved invaluable. The real dilemma: one cannot predict which regime lies ahead. Long-term investors typically accept the average outcome rather than attempt market timing.
Blind Spot: Are Current Bond Yields Sustainable?
A critical failure mode for this analysis exists: the assumption that elevated bond yields (3–4%) persist. Historical medians sit closer to 2%. If rates compress back to 1–2% over the next three to five years, current bondholders capture capital appreciation, but subsequent investors lock in lower coupon income. An investor adding to the bond sleeve in 2027–2030 would receive materially lower annual yield than today’s levels, compressing long-term CAGR. Conversely, if inflation resurges, nominal yields may exceed real returns, eroding the attractiveness of holding bonds at current levels. Both scenarios undermine the optimistic return assumptions embedded here.
Frequently Asked Questions
Is 60/40 still relevant, or should current rates favor a 40/60 (bond-heavy) tilt?
Current data confirms that 2024 bond yields (3.5–4.5%) exceed historical averages. However, the logic that "higher yields = higher bond allocation" conflates yield levels with expected returns. Future rate paths remain uncertain, and credit spreads fluctuate with the cycle. 60/40 represents an academically neutral starting point for moderate-risk investors; individual circumstances (time horizon, loss tolerance, income needs) require adjustment.
How frequently should rebalancing occur?
Quarterly (three-month) or semi-annual (six-month) rebalancing is standard practice. Monthly rebalancing incurs excessive transaction costs and tax friction. Annual rebalancing risks drift. A threshold-based approach—rebalancing only when allocations drift ±5% from target—further reduces friction. The optimal frequency depends on portfolio size, tax drag, and transaction costs at your custodian.
How are distributions typically withdrawn after 10 years of accumulation?
Lump-sum withdrawal is rare; sustained withdrawal (annuity-style) is typical. The widely referenced "4% rule" suggests that withdrawing 4% of terminal portfolio value annually can sustain spending for 30+ years. A $250,000 portfolio would support $10,000 annual withdrawal. Tax efficiency in withdrawal sequencing (which accounts to draw from first) varies by account type and individual circumstances and should be reviewed with a tax advisor.
How does interest-rate risk in bonds affect a 60/40 portfolio's downside protection?
A 40% bond allocation traditionally acts as an equity hedge. However, 2022 demonstrated that rising rate environments can drive simultaneous equity and bond losses, eroding the diversification benefit. Some investors introduce short-duration bonds, Treasury inflation-protected securities (TIPS), or modest cash allocations to mitigate this tail risk. Long-term evidence still favors traditional nominal bonds on total-return grounds.
What happens if contributions are irregular rather than monthly?
Dollar-cost averaging still operates, but outcomes hinge on contribution timing. An investor who deploys $120,000 as a lump sum at a market low outperforms a disciplined monthly investor; the reverse is true if deployment coincides with a peak. Monthly regularity dampens timing luck and is thus preferred by most practitioners.
Final Perspective: Compound Returns Are Means, Not Ends
The 60/40 portfolio’s true edge is not raw return but risk-adjusted return—the Sharpe ratio (return per unit of volatility). Over 2016–2026, 100% equity portfolios (VOO alone) delivered the highest gains but also the steepest drawdowns. 60/40 sacrificed some upside to suppress volatility by roughly 30–40%. This matters psychologically. An investor who endured 2022’s 18% equity plunge and held course captured the subsequent 2023–2025 rebound in full. A portfolio that lost only 11% was psychologically more defensible and thus more likely to be maintained through stress. This is why portfolio construction is often framed as a process, not an outcome. Market consensus equates higher returns with superior allocation. The evidence suggests that sustainable (tolerable) returns beat unsustainable ones. Sustainability emerges from volatility the investor can psychologically withstand. 60/40 has historically struck this balance most durably, and the past decade’s data reinforces that case.
This site is supported by Google AdSense advertising revenue. We receive no compensation or sponsorship from any ETF, broker, or financial product.