- $1,500/month at 7% DRIP CAGR over 20 years = ~$782K; at 4%, ~$550K — a $232K gap driven entirely by the assumed return rate
- Every 1% shift in assumed return adds or removes ~$110K–$130K in terminal value at year 20; sensitivity is nonlinear
- Tax drag in taxable accounts reduces effective reinvestment yield by 15–25%; account type is a primary, not secondary, variable
- 2020 S&P dividend cuts (~14% aggregate quarterly reduction) pushed realized DRIP rates 200bps below model assumptions for high-yield ETFs
- DRIP reinvestors during the Q1 2020 drawdown outperformed non-reinvestors by 12–18% by year-end — a volatility effect flat-line models ignore entirely
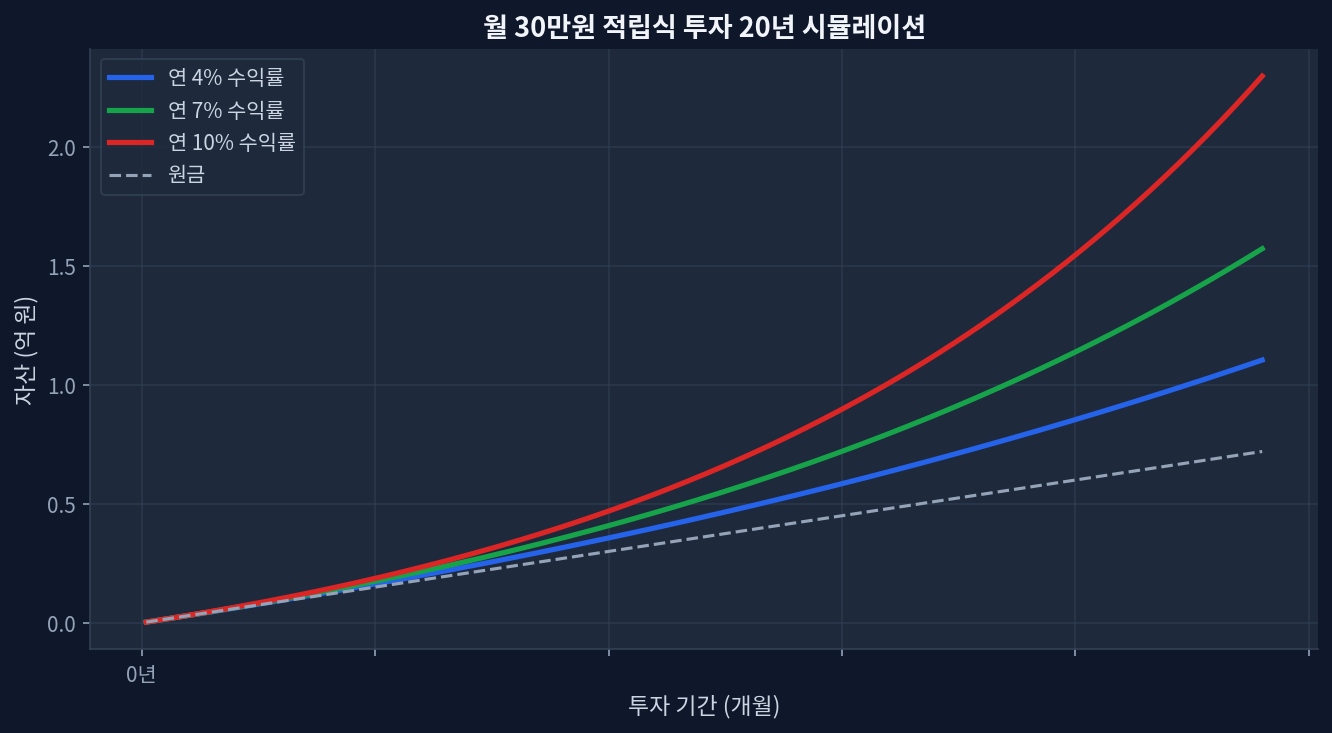
What the 20-Year Simulation Data Actually Shows

Running $1,500/month at 4%, 7%, and 10% for 20 years produces a divergence that widens sharply in the back half of the period. At year 10, the gap between the 4% and 10% paths is roughly $200K. By year 20, that gap exceeds $590K. The simulation chart above captures the inflection clearly: the 10% curve breaks away from the 4% path around year 12, when accumulated DRIP dividends begin compounding on themselves at scale.[FRED]
The critical sensitivity: a 3-percentage-point difference in assumed return — the gap between pessimistic (4%) and consensus (7%) — cuts terminal value by 30%. Most retail DRIP calculators present 7–8% as default without flagging this. The omission matters most in the final five years, when compounding effects are largest and most exposed to return-assumption errors that have already been locked in by decade one.
Where Consensus Assumptions Break Down
Standard DRIP models embed three assumptions: stable or growing dividends, reinvestment at fair-value prices, and no tax friction. The 2020 COVID shock broke assumption one directly — S&P 500 companies cut approximately $55 billion in quarterly dividends, a 14% aggregate reduction. A DVY holder (then yielding ~5%) saw the realized DRIP rate drop below 3% for two quarters — a 200-basis-point shortfall that compounds negatively over the remaining horizon.
In taxable accounts, assumption three adds further drag. At 3% gross yield and 15% qualified dividend tax, the after-tax DRIP rate is 2.55%. Roth IRA eliminates this entirely; traditional 401(k) defers it. Account structure alone shifts 20-year outcomes by $50K–$80K on a $1,500/month program — not a rounding error.[IRS Pub. 550]
Dividend ETF Peer Comparison
| ETF | Expense Ratio | Yield (TTM) | 5Y Total Return | 1Y Total Return |
|---|---|---|---|---|
| SCHD | 0.06% | 3.4% | +72% | +8% |
| VIG | 0.06% | 1.8% | +85% | +12% |
| VYM | 0.06% | 2.9% | +65% | +10% |
| DVY | 0.38% | 4.8% | +48% | +6% |
| DGRO | 0.08% | 2.3% | +78% | +11% |
VIG’s 5-year +85% leads the peer group — driven more by price appreciation than yield reinvestment. DVY’s higher gross yield produced the weakest 5-year total return, a direct challenge to the assumption that higher yield equals better DRIP outcome.[ETF.com] Sector concentration in utilities and financials dragged DVY through the 2022 rate cycle. The data diverges from market consensus on dividend investing: yield and DRIP compounding power are not the same variable.
The Volatility Multiplier: When DRIP Amplifies and When It Misfires
The contrarian read on DRIP mechanics: reinvestment during drawdowns functions as accelerated dollar-cost averaging. Investors who held through Q1 2020 (S&P -34% peak to trough) bought shares at 2016-equivalent prices. By December 2020, those units had gained 50%+ from the March lows. No flat-line simulation captures this dynamic. The 7% consensus base case likely understates outcomes for investors who stayed invested through the volatility episodes of 2018, 2020, and 2022.
The structural risk runs the other way, too. DRIP in a sustained bear market — Japan 1990–2010 being the clearest modern case — continuously reinvests into declining assets. Accumulated units don’t compound positively if the underlying price never recovers. U.S. investors have not experienced this in living memory, which explains why it remains systematically underweighted in retail DRIP discussions.
Scenarios where this analysis could be wrong: (1) corporate payout ratios contract if buyback taxation shifts capital allocation away from dividends; (2) a low-return decade at the simulation start triggers sequence-of-returns drag before compounding has meaningful scale; (3) rising index concentration in non-dividend-paying tech reduces aggregate S&P yield below 1%, making yield-focused ETFs a shrinking fraction of total market exposure.
Frequently Asked Questions
Does DRIP make sense in a taxable account?
At 3% yield and 15% dividend tax, after-tax DRIP rate is 2.55% — well below what most models assume. Tax-advantaged wrappers (Roth IRA, 401(k)) eliminate this drag entirely, shifting 20-year terminal value by $50K–$80K on a $1,500/month program.
How much does a 1% DRIP return difference change 20-year outcomes?
On $1,500/month, each additional 1% of assumed return adds ~$110K–$130K in terminal value at year 20. The relationship is nonlinear — sensitivity is larger at higher base rates, which is why the 7%-to-10% gap ($357K) exceeds the 4%-to-7% gap ($232K).
Which dividend ETFs have the most consistent DRIP track record?
VIG and SCHD have maintained uninterrupted quarterly dividends since inception. VIG averaged approximately 7% annual dividend growth over the past decade. DVY showed higher variability, particularly during the 2020 COVID cut cycle.
What is the consensus DRIP return assumption and why is it incomplete?
Most calculators default to 7–8% based on long-run S&P 500 averages. This excludes account-type tax drag (15–25% yield reduction in taxable accounts), dividend variability (2020 cuts reached 14% of aggregate S&P payments), and sequence-of-returns risk for investors starting at high valuation multiples.
Does automated DRIP outperform manual dividend reinvestment?
Evidence suggests retail investors manually reinvest roughly 60–70% of dividends versus near-100% with automated DRIP programs. Over a 20-year horizon, that behavioral gap compounds meaningfully even when investment selection is otherwise identical.