JEPI's 10.3% Dividend Hike Masks Troubling Total Return Gap vs. SCHD
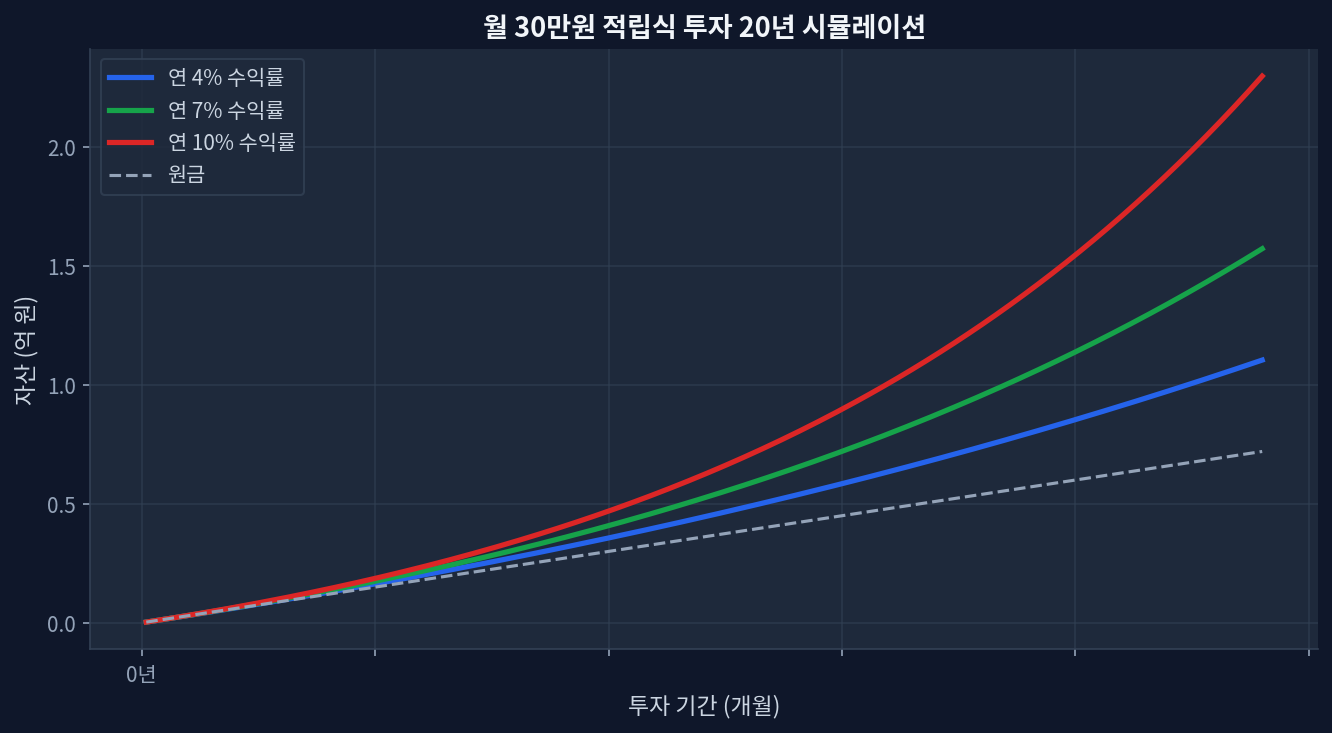
JEPI quarterly dividend raised to $0.3870 (up 10.3% year-over-year)Current dividend yield: 8.08% (elevated) vs 1-year total return: +7.4% (weak)5-year cumulative return: +42.5% vs SCHD +54.9% (2.4%p annual underperformance)P/E ratio 26.8 (SCHD 19.0) represents 40% valuation premium; trading at 30.2% of 52-week range (multi-year low)Cash extraction pressure: elevated dividend payouts compress capital preservation capacity, weakening price support The Structural Dilemma Behind the Dividend Raise Monthly $30K investment 20-year compound growth simulation 20-year monthly investment simulation showing dividend and capital gain divergence JEPI’s quarterly dividend increase to $0.3870—a 10.3% rise from the prior-year $0.3508—presents as a positive signal on the surface. Yet for a $44.7 billion ETF to merit attention primarily for a dividend raise already signals a deeper issue. ...