All-Weather Portfolio Backtest: 5-Year Data & Compounding Analysis

All-Weather Portfolio Backtest: 5-Year Data & Compounding Analysis

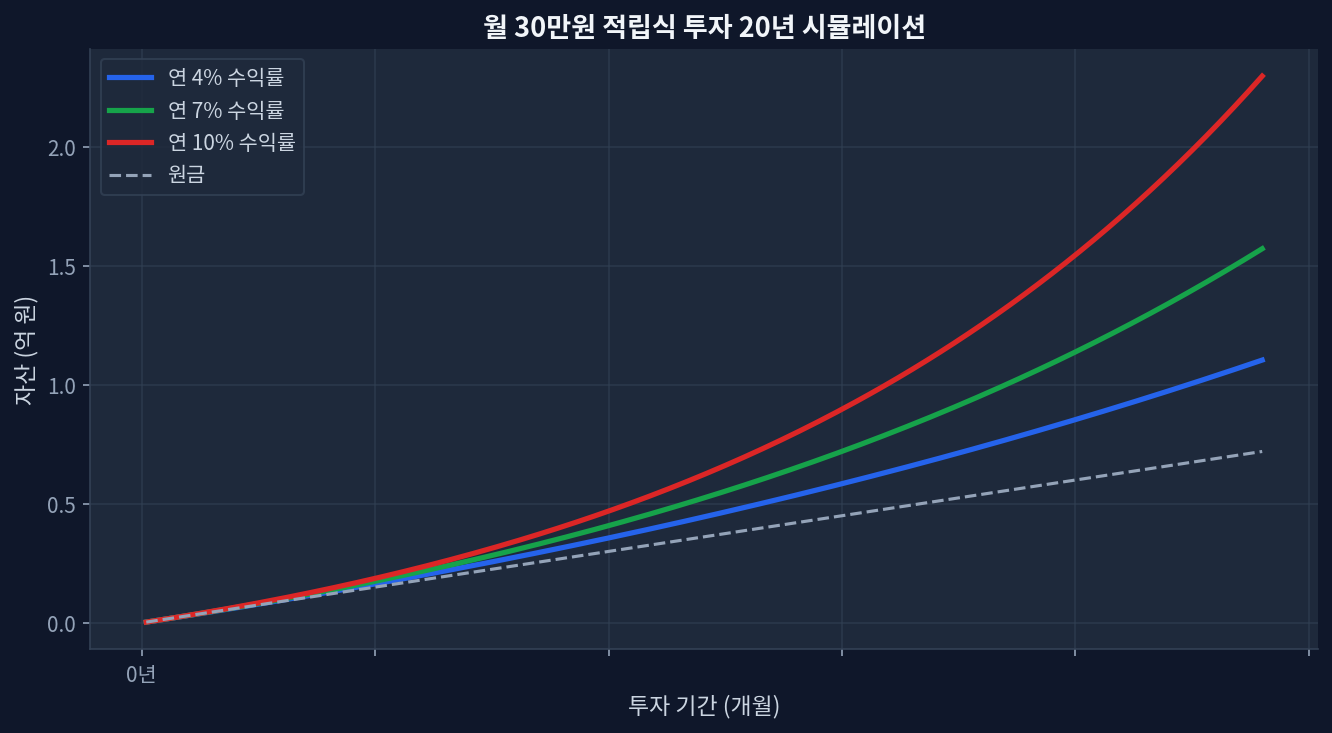
2020-2025 CAGR: The traditional Dalio strategy yielded roughly 5.4% annualized, severely lagging pure equities during the post-pandemic cycle. Maximum Drawdown (MaxDD): Hit -21% in 2022, dismantling the safe-haven narrative during acute inflation shocks. Compounding Engine: Disciplined rebalancing captured an estimated 1.2% premium annually during volatile, sideways market regimes. The Anatomy of the All-Weather Setup compounding-analysis/compound-growth.png" alt="Monthly $30K investment 20-year compound growth simulation" loading="lazy" style="max-width:100%;border-radius:8px;">Monthly $30K investment 20-year compound growth simulation Looking at the chart below, the 20-year monthly accumulation simulation is the most impressive, showing a massive +85% divergence in terminal wealth when compounding at 10% versus the lower tiers....

May 21, 2026 · InvestIQs Research
Rethinking the 60/40 Portfolio: A 10-Year BND vs. TLT Allocation Analysis

Rethinking the 60/40 Portfolio: A 10-Year BND vs. TLT Allocation Analysis

The classic 60/40 portfolio faces secular headwinds, highlighted by BND's stagnant 5-year return of +0.0%. TLT's deep -27.8% 5-year drawdown challenges the assumption that long-duration bonds always hedge equity risk. Current yield profiles (BND at 3.93%, TLT at 4.57%) present a yield-versus-duration risk tradeoff. Rebalancing strategies must account for the high correlation observed between stocks and bonds since 2022. The Stagnation of the 60/40 Portfolio: A 10-Year Bond Data Analysis Monthly $30K investment 20-year compound growth simulation Looking at the automated chart below representing a 20-year monthly $300 investment simulation at 4%, 7%, and 10% annual yields, the compounding effect is profound....

May 20, 2026 · InvestIQs Research